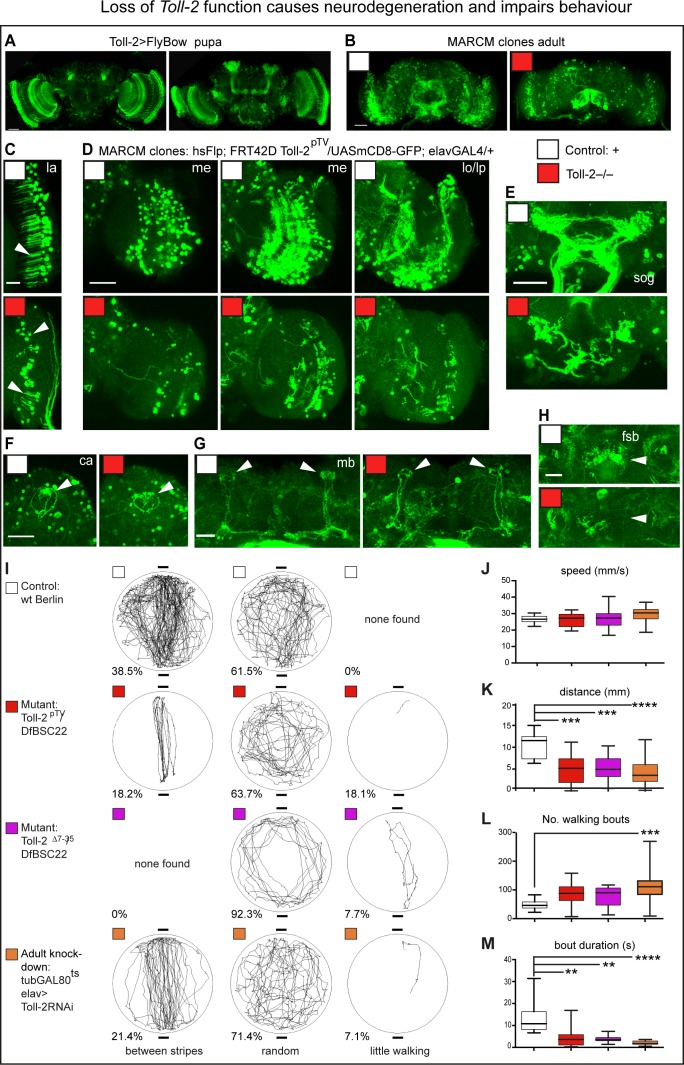
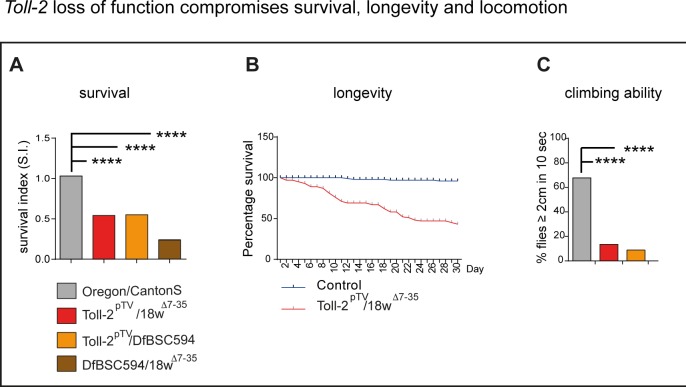
Figure 3. Loss of Toll-2 function caused neurodegeneration and impaired behaviour.
(A) Toll-2 is expressed in pupal brains, most prominently in optic lobes, mushroom bodies and SOG. (B–H) Toll-2pTV mutant MARCM clones - labelled with GFP - induced in pupa cause neuronal loss throughout the adult brain (genotype of clones: elavGAL4, UASmCD8GFP, hsFlp; neo FRT42D Toll-2pTV/neo FRT42D Toll-2pTV). Compare controls with Toll-2 mutant clones in: (B) whole brains; (C) loss of neurons and dendrites (arrow) in lamina (la); (D) neuronal loss, misrouted and/or aberrant axons in optic lobe; (E) loss of sub-esophageal ganglion (SOG) neuropile; (F,G) Calyx (ca) and mushroom bodies (mb) were less affected; (H) loss of fan shaped body (fsb) neuropiles. me: medulla; lo: lobula; lp: lobula plate. (I–M) Buridan arena behavioural assay revealed impaired locomotion with Toll-2pTV loss of function. (I) Representative trajectories of single flies filmed for the same amount of time, walking in a lit-up arena, with two diametrically opposed dark stripes. Phenotypes were divided into three categories – between stripes, random, little walking - and percentages indicate how many flies per genotype showed each phenotype (penetrance); no statistically significant differences were found. (J–M) Automatic measurement of locomotion parameters with purposely written software. Toll-2 mutant flies walked less than controls: they achieved equal speeds as controls, but they had more walking bouts that were brief, and thus walked shorter distances. Box-plots, quantifications: (J, K, L) One Way ANOVA: (K) p<0.0001; (L) p<0.01; (M) Kruskal-Wallis ANOVA p<0.0001; stars indicate post-hoc (J,K,L) Dunnett and (M) Dunn’s test comparisons to fixed controls. Scale bars: A,B,D,E,F: 50 μm; C,G,H: 25 μm. *p<0.05; **p<0.01; ***p<0.001; ****p<0.0001. For genotypes, sample sizes and statistical details, see Supplementary file 2. See Figure 3—figure supplement 1.


