. 2020 Feb 24;9:e54387. doi: 10.7554/eLife.54387

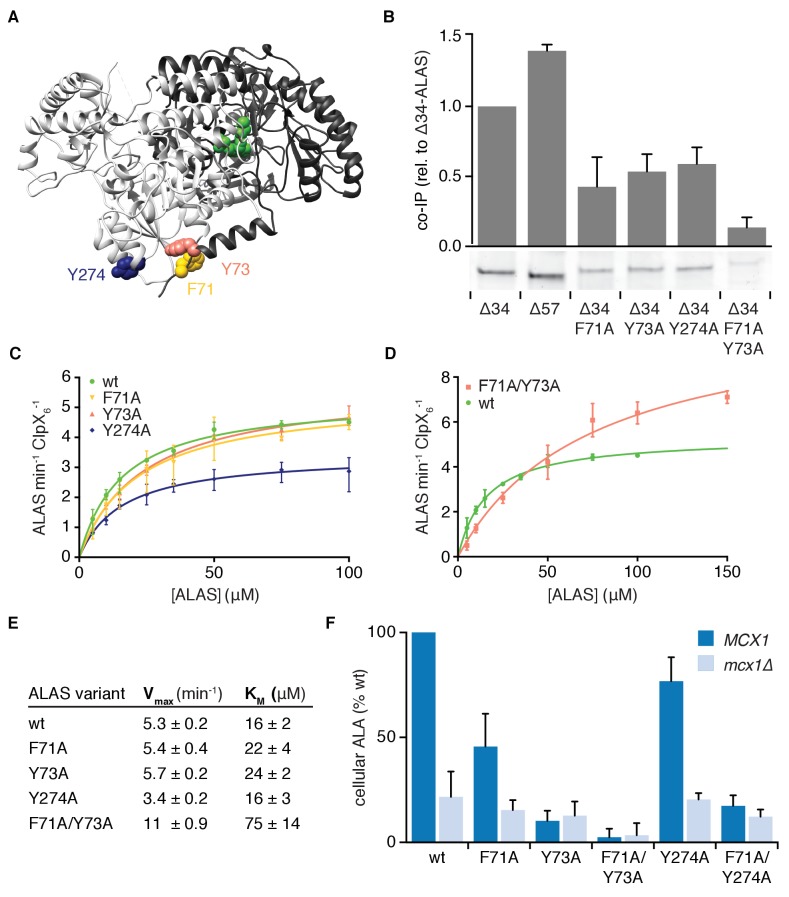
Figure 3. Multiple sequence-specific contacts direct mtClpX action on ALAS.

(A). The position of mutations that perturb mtClpX binding are mapped on one face of the structure of ALAS (PDB: 5TXR [Brown et al., 2018]) (F71 in yellow, Y73 in orange, and Y274 in dark blue). PLP is depicted in green. (B) Coimmunoprecipitation of ALAS variants with mtClpXE206Q-3xFLAG. 1 μM ALAS (monomer) and 0.5 μM mtClpXEQ-3xFLAG (hexamer) were incubated on ice with anti-FLAG antibody-conjugated magnetic beads. Coprecipitating proteins were eluted with 3xFLAG peptide. Eluted proteins were separated by SDS-PAGE and stained with Sypro Red. The bar graph above each lane of the gel represents the average intensity of the band from three independent experiments, normalized to wildtype Δ34-ALAS; error bars represent SD. (C–D) The rates at which mtClpX stimulated PLP binding to indicated ALAS variants are plotted as a function of ALAS monomer concentration; rates were determined and fit to the Michaelis-Menten equation as in Figure 2C. mtClpX was present at 0.5 μM hexamer (C) or 1 μM hexamer (D). Wildtype ALAS (Δ34-ALAS) data represented in Figure 2C is replotted in both panels. N = 3 for all variants. (E) Chart of parameters extracted from fits in (C–D) as in Figure 2C. Standard error of the fit is stated. (F) The levels of ALA in extracts from yeast strains harboring the indicated mutations in ALAS (HEM1 gene), with (MCX1) or without (mcx1Δ) the gene encoding mtClpX, were measured by colorimetric assay with modified Ehrlich’s reagent. p<0.001 for reduced ALA production in MCX1 strains by all mutations displayed in HEM1; p=0.05 for reduced ALA production in mcx1Δ hem1F71A/Y73A, n ≥ 3 for all strains; error bars represent SD.

Figure 3.

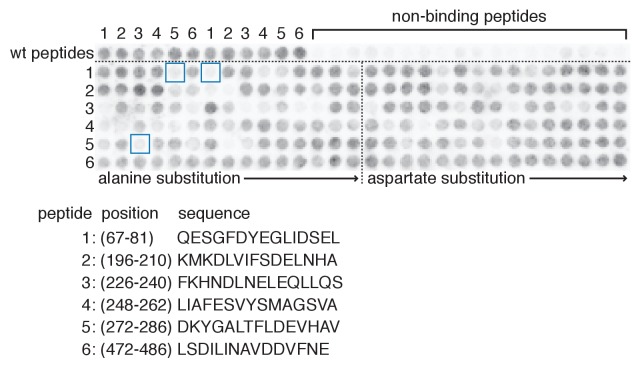
Figure 3—figure supplement 1. mtClpX-binding sequences in ALAS.

Figure 3—figure supplement 1.

15-amino-acid peptides derived from mtClpX-binding sequences determined in Figure 1A were scanned at each position with alanine and aspartate in a peptide array. The top row of the array contains the wildtype peptides (repeated twice, left to right) and non-binding peptides (peptides that mtClpX did not bind in Figure 1A). Non-binding peptides are arrayed in the following series, repeated three times: LIDSELQKKRLDKSY (76-90), DSELQKKRLD-KSYRY (78-92), LEQLLQSYPKSVPKL (234-248), QLLQSYPKSVPKLIA (236-250), VRDPIVKQLEVSSGI (532-546), DPIVKQLEVSSGIKQ (534-548). Blue boxes represent ALAS variants analyzed.
Figure 3—figure supplement 2. Structure and function of mtClpX-interacting residues in ALAS.

Figure 3—figure supplement 2.

(A) Spontaneous binding rates of PLP to indicated ALAS variants. Rates were determined by linear fits to the pseudolinear early phase of PLP binding, measured by fluorescence (ex. 434 nm, em. 515 nm). ALAS variants were present at 10 μM, PLP at 150 μM, and ATP at 2 mM with a regenerating system. (B) CH-pi and H-bonding interactions (depicted as yellow bars) mediated by the side chains of mtClpX-interacting residues F71 and Y73 (in protomer rendered in dark gray) with residues on the other protomer (rendered in light gray). (C) Activity of purified ALAS variants was monitored in vitro using modified Ehrlich’s reagent in a colorimetric assay (see Materials and Methods). Error bars represent SD of three independent assays; p<0.01 for reduced ALASF71A/Y73A with or without PLP. (D) Relative protein levels of ALAS-3xMyc variants in vivo, determined by western blotting of yeast cell extracts with mouse anti-Myc antibody (9E10 clone, Sigma-Aldrich) and IRDye 800CW Goat anti-rabbit IgG (Li-Cor) and visualized with an Odyssey scanner (Li-Cor).