
Figure 1: Reducing microtubule density or detyrosination decreases human myocyte viscoelasticity.
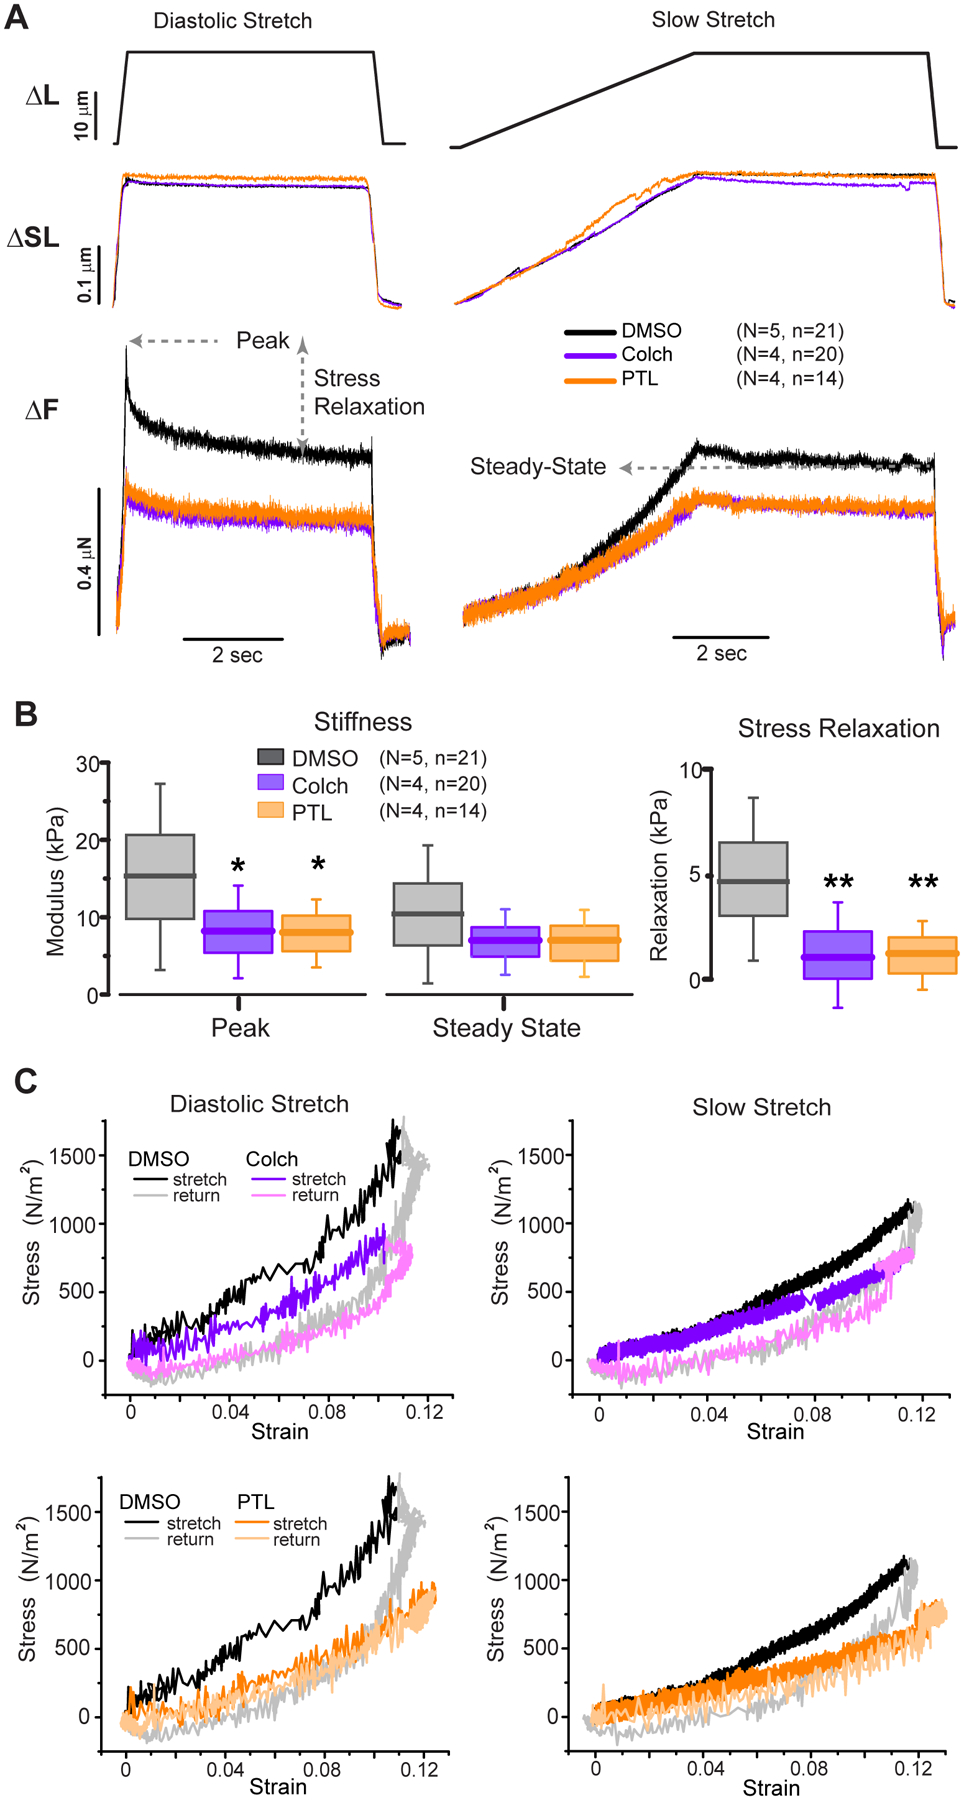
A, Average cellular responses to diastolic and slow stretching assay. Top: Stretching protocol showing either 200 ms or 5 s stretch followed by 5 s hold and 200 ms return to slack length. Middle: Corresponding sarcomere length change in response to stretch protocol. Bottom: force in response to stretch protocol. Peak, stress relaxation, and steady state forces are depicted. B, Box plots of peak (diastolic) and steady state (elastic) stiffness, and stress relaxation. Box plots represent mean (line), standard deviation (box) and 25–75th percentile (whisker). Significance *p<0.05, **p<0.01, one-way ANOVA with post-hoc Bonferroni comparison. C, Stress-strain plots showing hysteresis of cardiomyocytes treated with DMSO vehicle (black/gray - duplicated) or colchicine (purple – top) or parthenolide (orange – bottom) for diastolic stretch (left) or slow stretch (right). The reduction in slope indicates decreased stiffness at the respective stretching speed, while the loop area indicates the energy dissipated during the protocol.