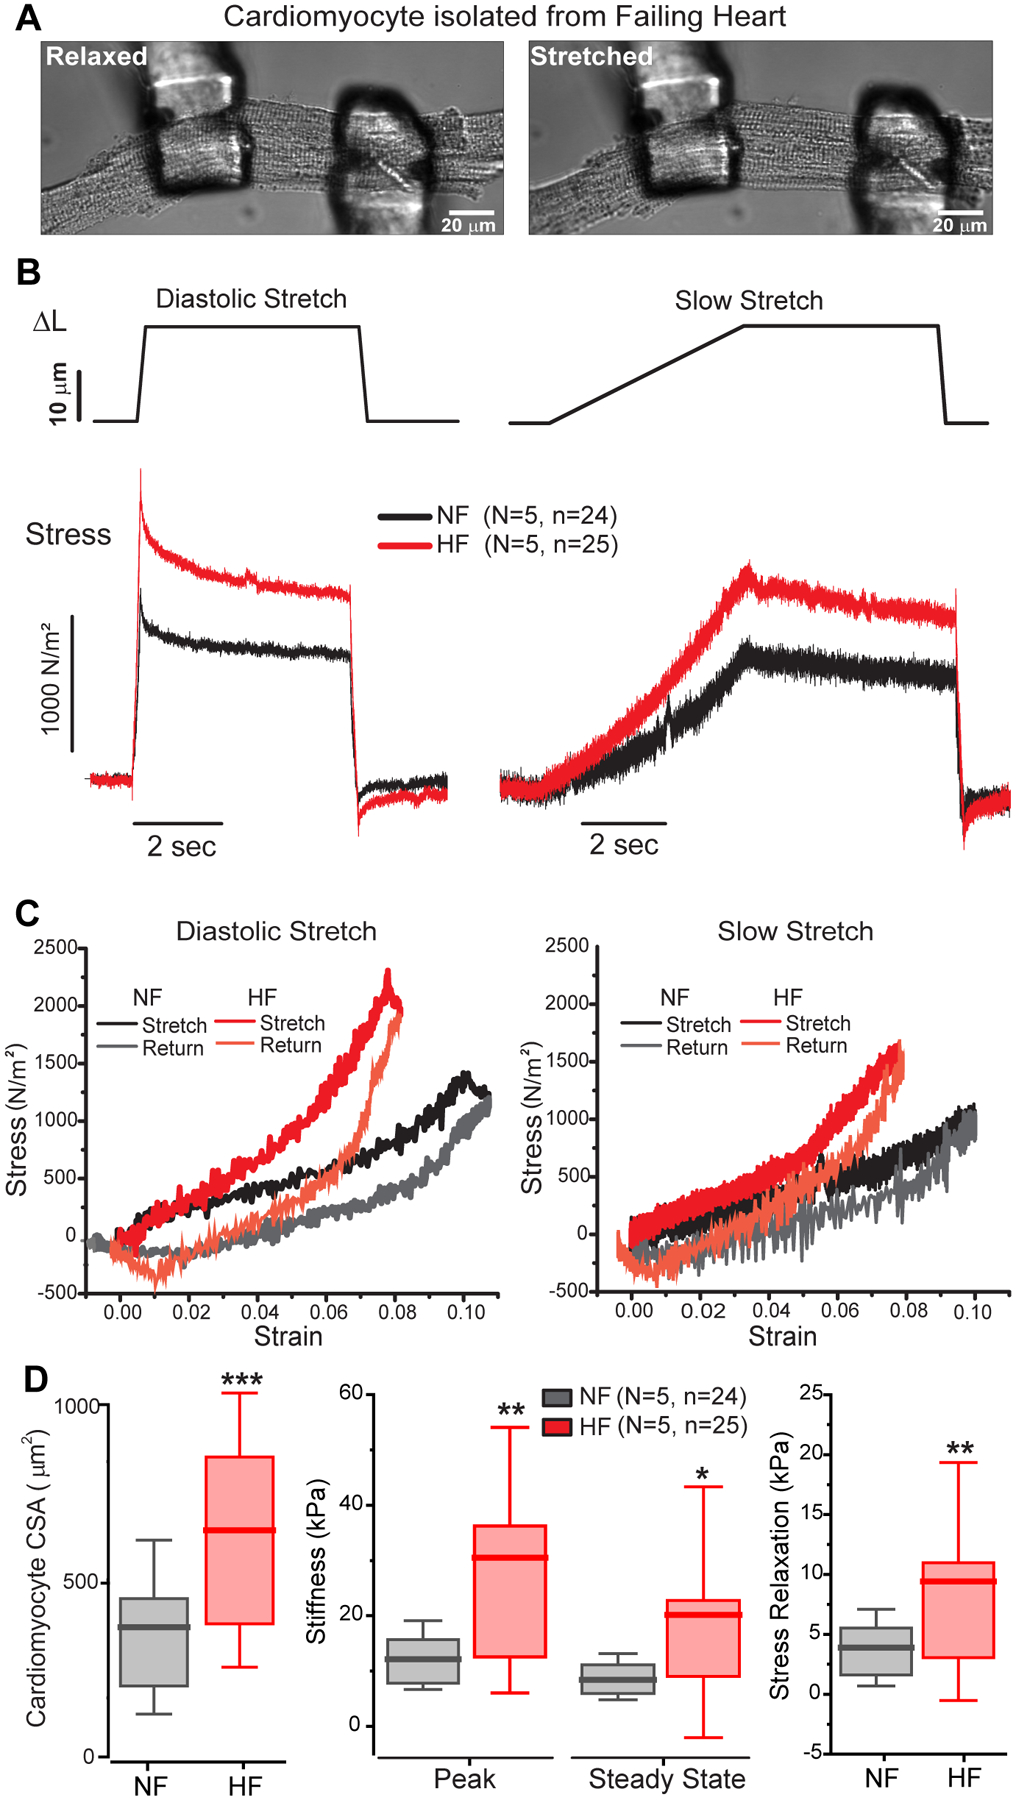
Figure 2: Viscoelasticity is increased in failing human cardiomyocytes.

A, Transmitted light image of failing human myocyte before (relaxed) and during (stretched) diastolic stretching assay. B, Average stress-time plots comparing 20 um stretches at diastolic (200 ms - left) or slow (5 s - right) strain rates in NF (black) and HF (red) cardiomyocytes. C, Stress-strain plots for diastolic (left) and slow (right) stretches. Slope denotes effective stiffness at each rate, while hysteresis indicates energy dissipation. D, Summary of myocyte cross sectional area (left) and stiffness parameters in NF and HF myocytes (right). Statistical significance determined via two sample T-test, *p<0.05, **p<0.01, ***p<0.001.
