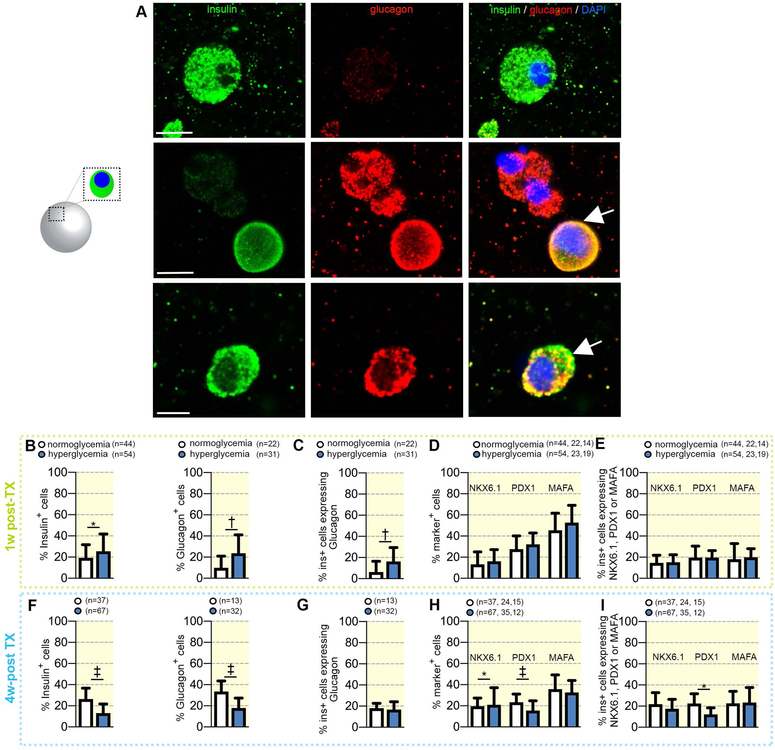
Figure 2. Comparison of hormone expression in encapsulated transplanted cells retrieved from either normoglycemic or diabetic mice.
(A) High magnification confocal imaging of representative insulin+ (green), glucagon+ (red) and bihormonal cells (arrows) cells (scale bar: 5μm). (B) Proportion of transplanted cells expressing insulin or glucagon in 1w_postTX conditions, (C) Fraction of insulin cells co-expressing glucagon (bihormonal cells) in 1w_postTX conditions, (D) Proportion of transplanted cells expressing NKX6.1, PDX1 or MAFA in 1w_postTX conditions. (e) Fraction of insulin+ cells co-expressing NKX6.1, PDX1 or MAFA in 1w-postTX conditions. (f) Proportion of transplanted cells expressing insulin or glucagon in 4w_postTX conditions, (g) Fraction of insulin cells co-expressing glucagon (bihormonal cells) and (h) Proportion of transplanted cells expressing NKX6.1, PDX1 or MAFA in 4w_postTX conditions,. (i) Fraction of insulin+ cells co-expressing NKX6.1, PDX1 or MAFA in 4w-postTX conditions. Data are shown as mean ± SD

