Figure 2.

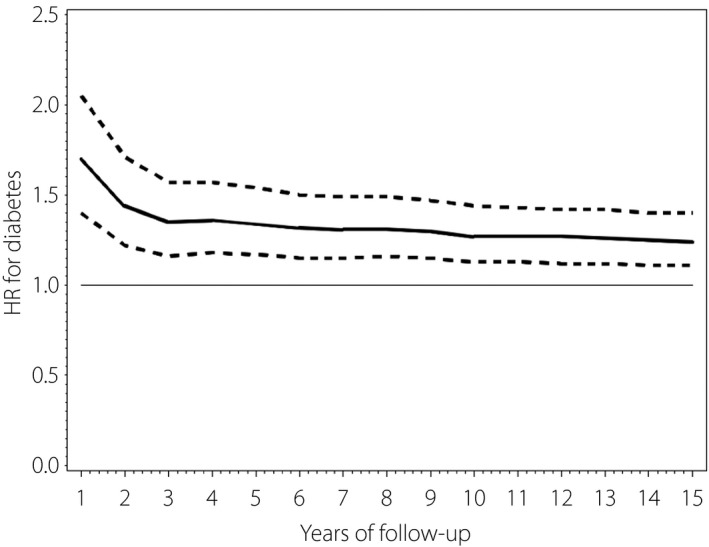
Adjusted hazard ratio (solid line) and 95% confidence intervals (dashed line) for the incidence of diabetes, breast cancer versus no breast cancer, over time. HR, hazard ratio.

Adjusted hazard ratio (solid line) and 95% confidence intervals (dashed line) for the incidence of diabetes, breast cancer versus no breast cancer, over time. HR, hazard ratio.