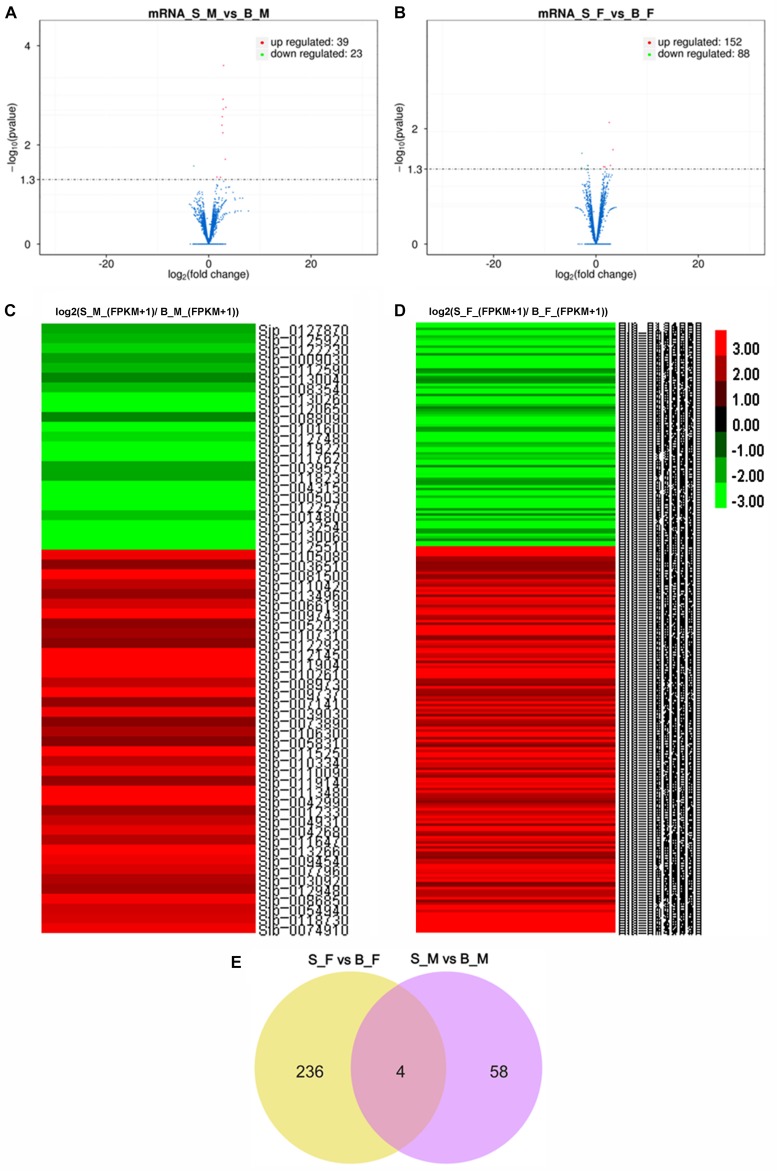
FIGURE 3.
Transcription profile analysis. (A,B) Volcano plots of the transcriptome profiles between S_M vs. B_M (A) and between S_F vs. B_F (B). (C) Heatmap of the transcriptome profiles based on the relative FPKM value ratios [log2(S_M_(FPKM + 1)/B_M_(FPKM + 1))] of all differentially expressed genes (DEGs) in S_M vs. B_M. (D) Heatmap of the transcriptome profiles based on the relative FPKM values [log2(S_F_(FPKM + 1)/B_F_(FPKM + 1))] of all DEGs in S_F vs. B_F.(E) Venn diagram of the differentially expressed genes (mRNAs) between S_F vs. B_F and S_M vs. B_M. Higher gene expression is shown in red, and lower gene expression is shown in green. B_F female worms from BALB/c mice, B_M male worms from BALB/c mice, S_F female worms from SCID mice, S_M male worms from SCID mice.

