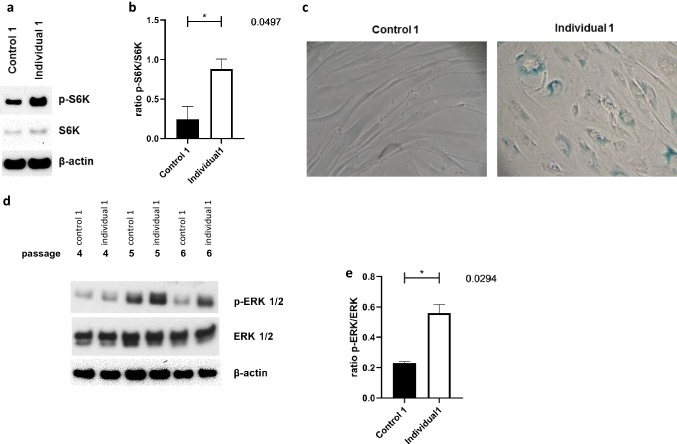
Fig. 5.
Senescence phenotype and abnormal activation of extracellular signal-regulated kinase (ERK1/2) in fibroblasts from individual 1. Protein analyses of phosphorylated S6 kinase (p-S6k) and total S6 kinase (S6k) normalized versus β-actin. Note the increased levels of p-S6k in patient’s fibroblasts relative to control sample in passage 6 (a). Quantification of phosphorylated S6 kinase (p-S6k) versus total S6 kinase (S6k) in three independent experiments in three subsequent fibroblast passages (P4-6), as shown in (a). Data are presented as mean ± SEM. Two-tailed Student’s t test (b). Fibroblasts shown were in passage 7. Representative image of increased SA-β-galactosidase staining in individual 1’s fibroblasts relative to control sample. Fibroblasts shown were in passage 7. Image was taken using 20× magnification (c). Protein analysis in three subsequent fibroblast passages (P4-6). Analyses of phosphorylated ERK1/2 (p-ERK1/2) and total ERK1/2 normalized versus β actin in individual 1’s dermal fibroblasts and a control sample. Note the increased levels of p-ERK1/2 in patient’s fibroblasts relative to control sample (d). Quantification of experiments in three subsequent fibroblast passages (P4-6), as shown in (d). Data are presented as mean ± SEM. Two-tailed Student’s t test (e)

