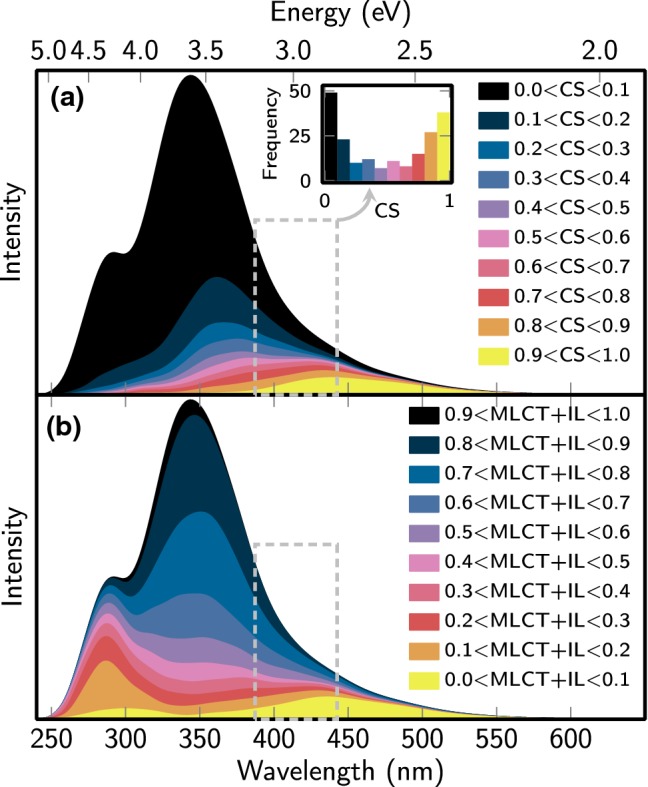
Fig. 4.

Simulated absorption spectrum and decomposition into different charge transfer contributions. In a, we decompose the spectrum into states with low CS contributions (black to blue) and high CS contributions (red to yellow). In b, we decompose the spectrum into states with high MLCT and/or IL contributions (black to blue) and low MLCT and/or IL contributions (red to yellow). The dashed boxes indicate the initial excitation window
