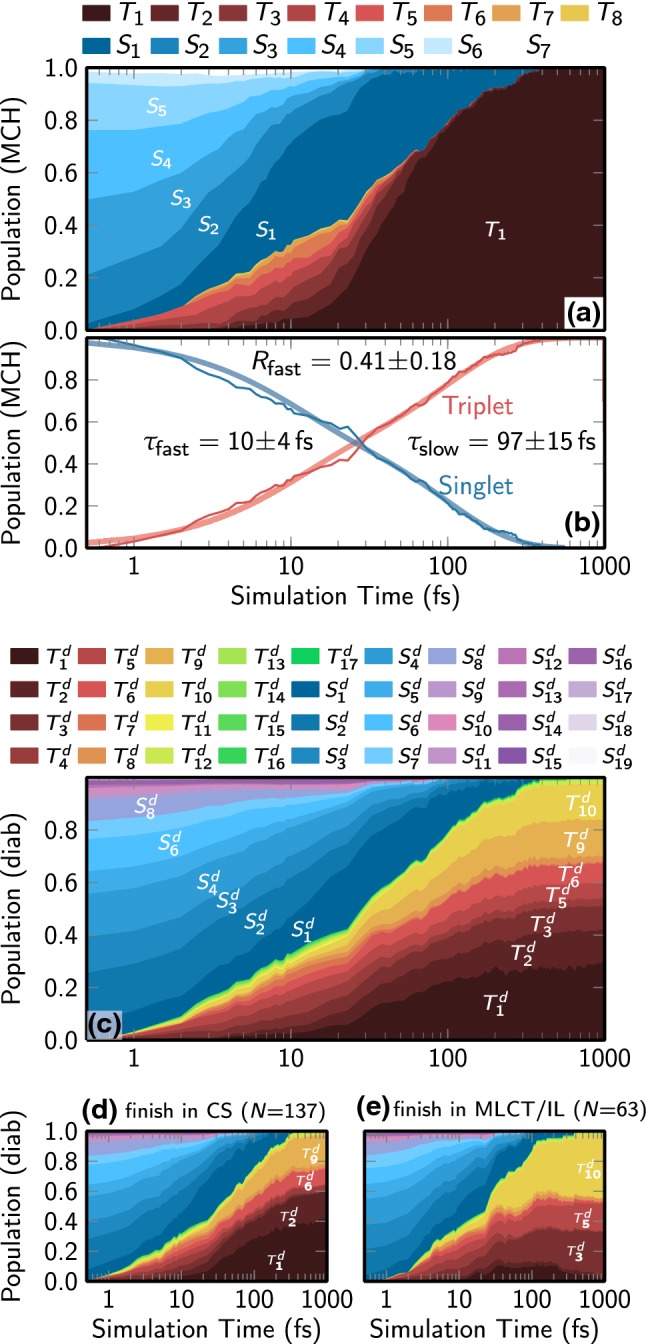
Fig. 5.

a Evolution of the electronic populations in the MCH representation. Note that higher states ( to , to ) are not populated and hence are not shown for clarity. b Sum of singlet and triplet states, together with curves fitted with a biexponential decay model. c Evolution of the electronic populations in the diabatic representation. Note that the state labels used here refer to the diabatic basis (superscript d), as shown in Table 1 and are not identical to the state labels in a. The lower panels show the diabatic populations for d trajectories finishing in an CS state and e trajectories finishing in an MLCT or IL state
