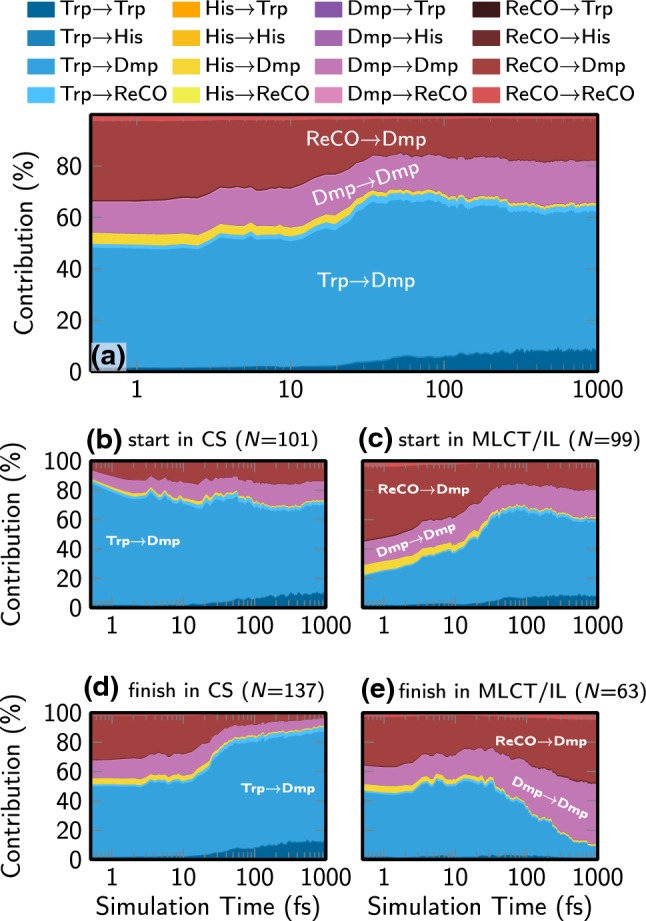
Fig. 6.

Evolution of the electronic populations in terms of the different charge transfer contributions as a stacked area plot. a Full ensemble of 200 trajectories. b Only trajectories with more than 50% CS contribution at . c Only trajectories with less than 50% CS contribution at . d Only trajectories with more than 50% CS contribution at fs. e Only trajectories with less than 50% CS contribution at fs. N in the labels refers to the number of trajectories
