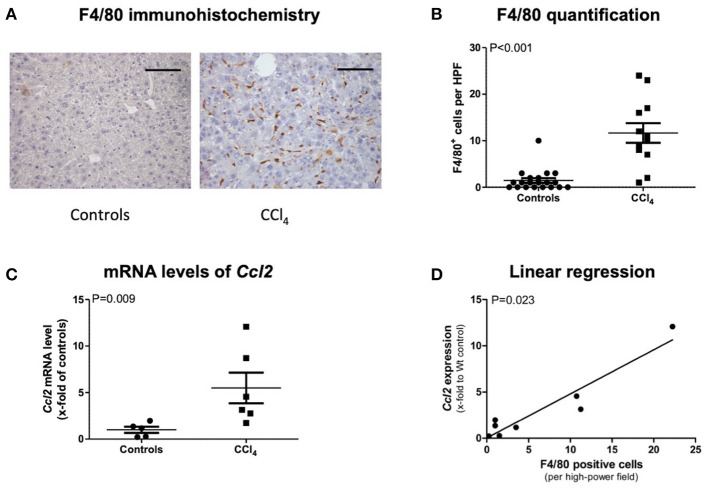
Figure 1.
F4/80 immunohistochemistry staining (A) and its quantification (B), transcript levels of CCL2 in livers of CCl4 intoxicated mice (C), and correlation of both (D). The scale bar is 100μm (A). Results are expressed as mean ± standard error of the mean (SEM); Mann–Whitney test (B,C). Controls: N = 5, CCl4 group: N = 6. Spearman's rank correlation (D).

