
FIGURE 1.
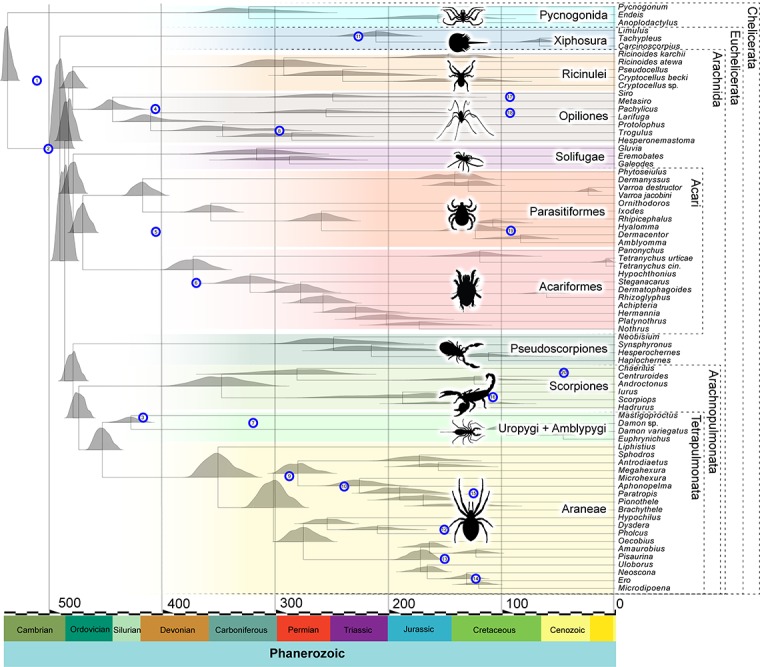
Chelicerate divergence times in the molecular clock analysis (outgroups not shown). Divergence times shown are obtained under the CIR autocorrelated, relaxed molecular clock model. Nodes in the tree represent average divergence times. The density plots represent the posterior distributions from the considered node. The numbered blue circles represent the age of the fossil calibrations and are located at a height corresponding to the node they are calibrating (see Table 1). In the timescale on the X axis, numbers represent millions of years before the present.