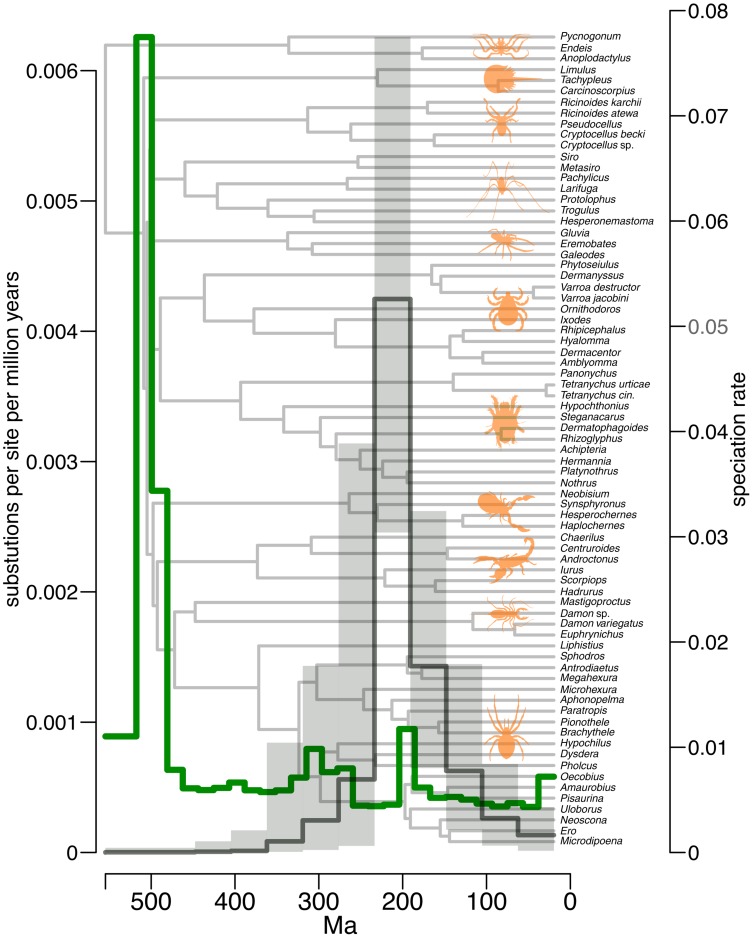
FIGURE 2.
Inferred rates of molecular evolution and diversification over time across chelicerates. Shown on the left Y axis are inferred amino acid substitutions per site per million years. On the right Y axis are diversification rates estimated with speciation rate as a proxy. Rates of molecular evolution are marked in green. Median speciation rates are marked in black with the highest posterior density of estimates shown in gray. In the timescale, numbers represent millions of years before the present.

