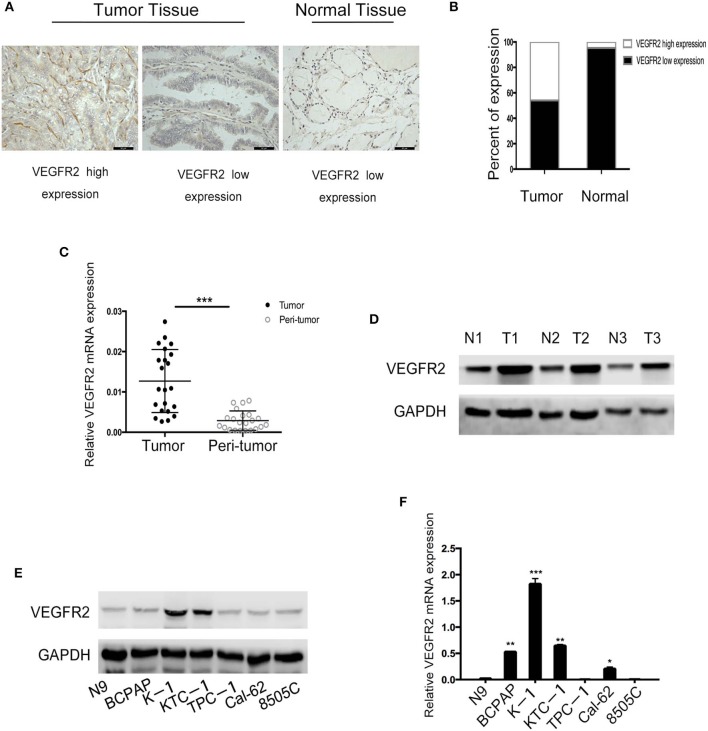
Figure 1.
VEGFR2 expression is elevated in PTC. (A) Immunohistochemical staining of a TMA containing PTC and normal thyroid follicular tissue specimens for VEGFR2. (B) VEGFR2 expression in PTC and normal thyroid follicular tissue. (C) VEGFR2 mRNA levels in PTC and normal thyroid follicular tissue. (D) Western blot assay showing increased VEGFR2 expression in PTC tissue compared to normal thyroid tissue. (E) Western blot assay of VEGFR2 expression in thyroid cell lines. (F) VEGFR2 mRNA levels in thyroid cell lines. Data are expressed as the mean ± SD (*P < 0.05, **P < 0.01, ***P < 0.001 vs. N9 cells).

