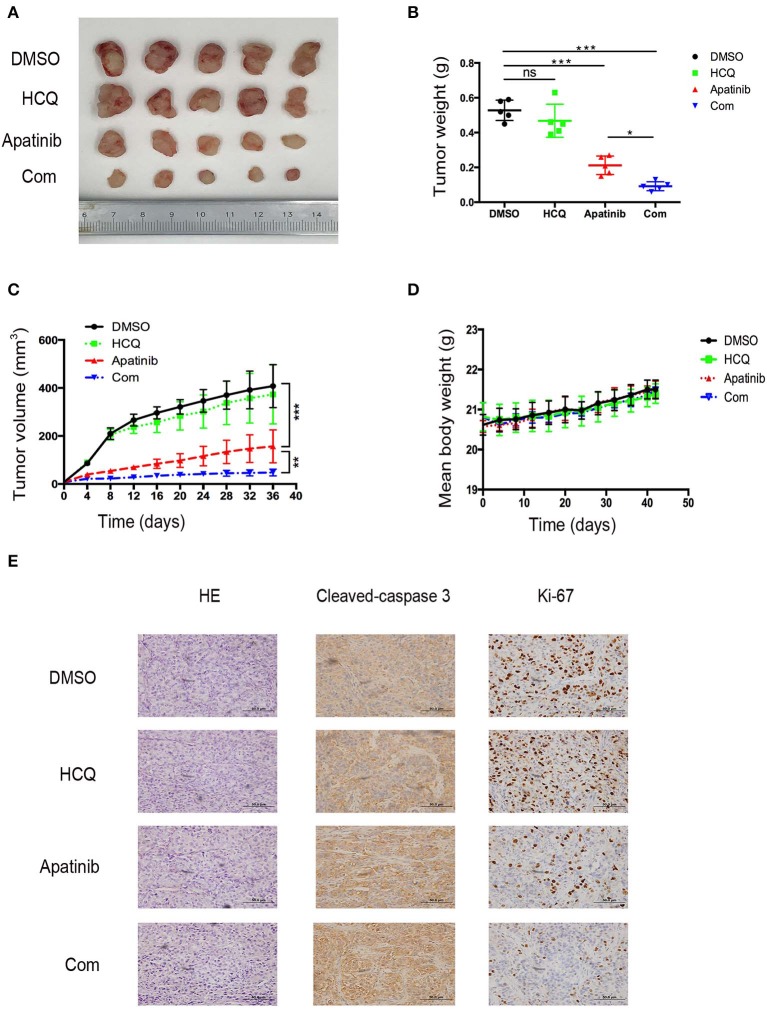
Figure 6.
Inhibition of autophagy enhanced the suppression of PTC growth by apatinib in vivo. (A) Images of tumors dissected from mice in the four groups (DMSO control group, HCQ single-treatment group, apatinib single-treatment group, and apatinib and HCQ combined treatment group) inoculated with K-1 cells. (B) Tumor weights in the four groups. (C) Tumor volumes in the four groups. (D) Mouse weights in the four groups. (E) HE and IHC staining to detect cleaved caspase 3 and Ki-67 in the four groups. Data are expressed as the mean ± SD (*P < 0.05, **P < 0.01, ***P < 0.001).

