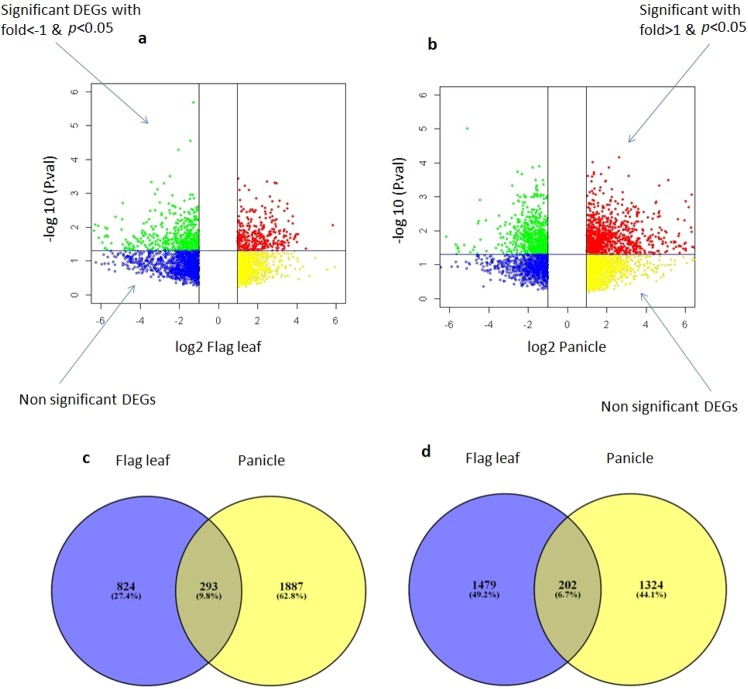
Figure 1.
Volcano plot showing gene expression differences in (a) flag leaf and (b) panicles of test hybrid IR79156A/IL50-13 with P-values and intensity ratios as log-scaled axes. Significant differences at p < 0.05 with >1-fold and <1 fold intensity ratios are shown. Blue: Fold <= −1 & p-value >0.05, Yellow: Fold >= 1 & p-value > 0.05, Green: Fold <= −1 & p-value <0.05, Red: Fold >= 1 & p-value <0.05. (c) Venn diagrams of up-regulated genes (d) down-regulated genes in flag leaf and panicle of test hybrid in comparison with control hybrid.

