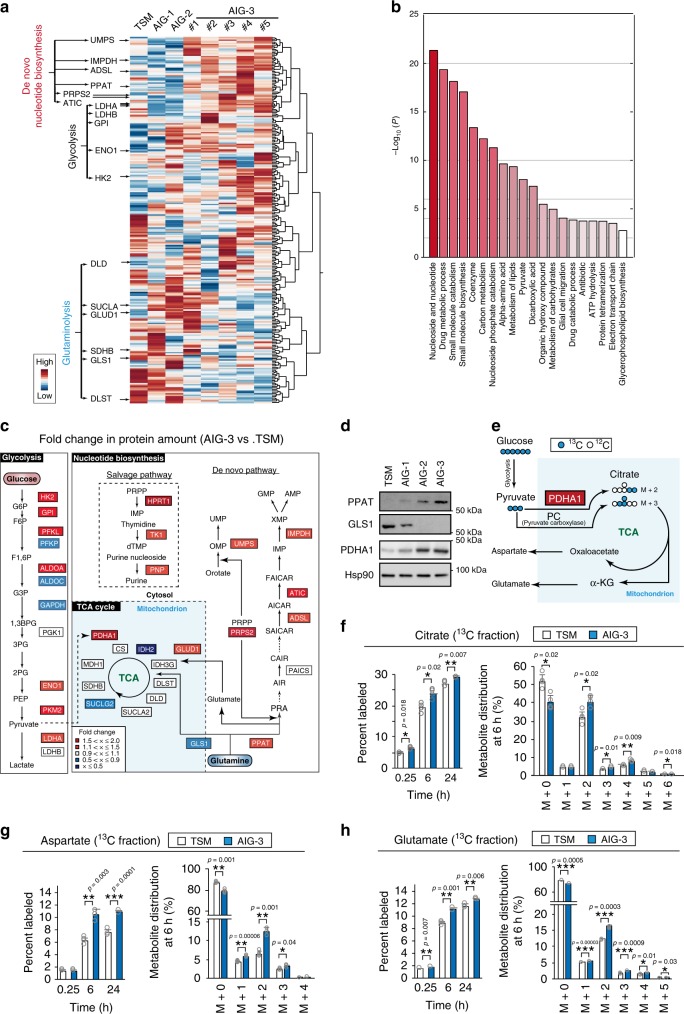
Fig. 2. Global view of proteomic changes in malignant cancer.
a Heat map for hierarchical clustering of metabolic enzymes measured by iMPAQT in TSM and AIG cell lines. The abundance of enzymes of the de novo nucleotide biosynthetic pathway was increased, whereas that of those of the glutaminolysis pathway was reduced, in AIG-3 cell lines compared with TSM cells. Measurements were conducted with three biological replicates (n = 3). Five independent AIG-3 lines (#1 to #5) were examined. Scale bar indicates z-scores for protein amount. b GO analysis of metabolic enzymes whose abundance as revealed by iMPAQT was changed in AIG-3 cells compared with TSM cells. The analysis was conducted with Metascape (two-sided, P ≤ 0.05), and adjusted P-values are shown (Benjamini-Hochberg false discovery rate). c iMPAQT-determined changes in the abundance of enzymes in the indicated metabolic pathways for AIG-3 versus TSM cells. d Immunoblot analysis of PPAT, GLS1, and PDHA1 in TSM and AIG-1 to -3 cells, was conducted with single time. e Schematic representation of [13C6]glucose metabolism. Blue and white circles represent 13C and 12C, respectively. f–h TSM and AIG-3 cells were exposed to 17.5 mM [13C6]glucose in monolayer culture for up to 24 h, after which the percentage of and distribution at 6 h for 13C-labeled citrate, aspartate, and glutamate, respectively, were measured by ion chromatography and mass spectrometry (IC-MS or LC-M). Metabolite measurements were conducted with four biological replicates, and data are means + s.d. *P < 0.05, **P < 0.01, ***P < 0.001 (paired two-tailed Student’s t-test). Source data are provided as a Source Data file.

