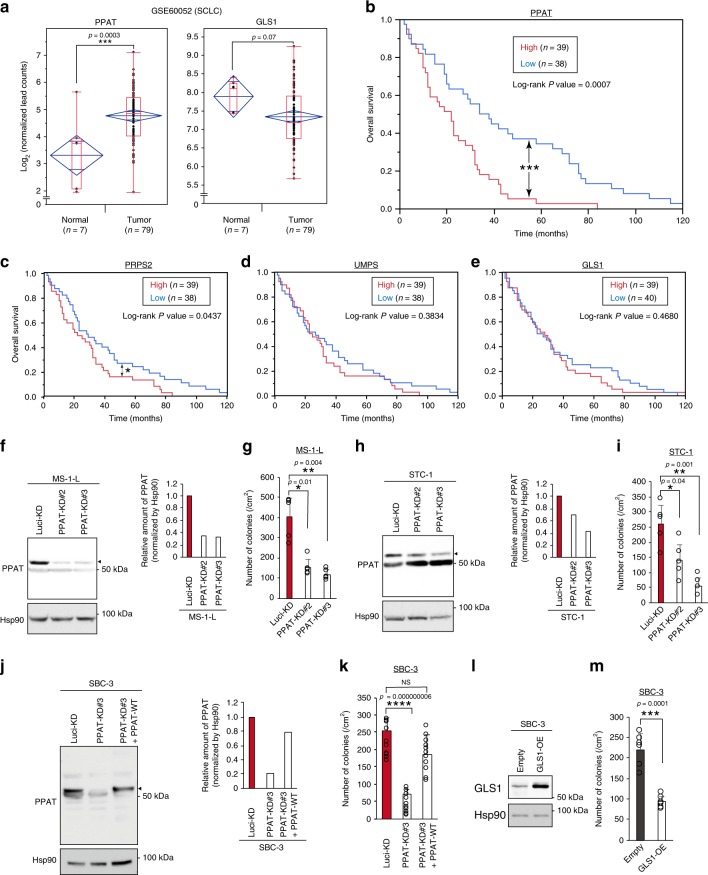
Fig. 7. PPAT as a new therapeutic target for SCLC.
a Box plots of PPAT and GLS1 gene expression levels in normal lung tissue (n = 7) or tumors (n = 79) from SCLC patients (GSE60052 data set). The upper and lower limits of the red boxes represent quartiles, with the line within the boxes indicating the median and the whiskers showing the extremes. Blue diamonds indicate confidence intervals. b–e Kaplan-Meier survival analysis for SCLC patients with high or low expression levels of PPAT (b), PRPS2 (c), UMPS (d), or GLS1 (e) genes in their tumors (GSE60052). Patients were divided according to the median gene expression level (Two-sided, P ≤ 0.05). f–k Immunoblot analysis of PPAT in MS-1-L (f), STC-1 (h), and SBC-3 (j) SCLC cell lines stably infected with retroviruses encoding luciferase control (Luci-KD) or two independent PPAT (PPAT-KD#2 or -#3) shRNAs, was conducted with single time. The intensity of PPAT bands (indicated by the arrowheads) was measured by densitometry (n = 1). In j, PPAT-depleted SBC-3 cells were also infected with a retrovirus for wild-type (WT) human PPAT. The proliferation rate in 3-D culture for the infected MS-1-L, STC-1, and SBC-3 cell lines was also determined (n = 5 [g and i] or 12 [k]). l Immunoblot analysis of GLS1 in SBC-3 cells stably overexpressing (OE) wild-type human GLS1 or infected with the corresponding empty retrovirus, was conducted with single time. m Proliferation rate in 3-D culture (n = 6) for cells as in l. In g, i, m, colonies were counted in two randomly selected fields in each of three dishes (n = 6). In k, colonies were counted in four randomly selected fields in each of three dishes (n = 12). Quantitative data in g, i, k, and m are means + s.d. *P < 0.05, **P < 0.01, ***P < 0.001, ****P < 0.0001 (paired two-tailed Student’s t-test [a, g, i, k, m] or log-rank test [b–e]). Source data are provided as a Source Data file.

