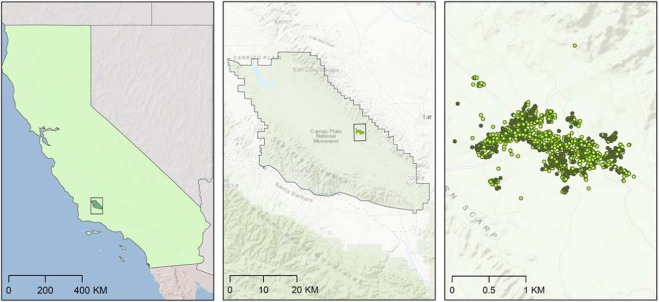
Figure 1.
A set of maps showing three different scales of potential animal occurrence data and subsequent models for an endangered animal species case study in California. From left-to-right, the first panel shows California within an inset denoting the regional sampling focus specific to this study. Data can be sampled throughout the entire range of a species depending on its distribution and extent and are typically modeled with Maxent. The middle inset maps the estimated home ranges using 95% minimum convex polygon models for the lizard species Gambelia sila within Carrizo National Monument, California, USA from 2016 to 2018. The inset on right shows the fine-grain telemetry relocation data collected as points. A total of 3553 instances were sampled for a total of 80 unique individual animals. Shrub and open designations describe whether the individual animal in each was instance was within 5 m of a shrub (dark green points) or in the relative open not near the canopy of a shrub (light green points). In this study, we use resource selection functions to infer predicted likelihoods of habitat use patterns at this scale. Base map credits ESRI.

