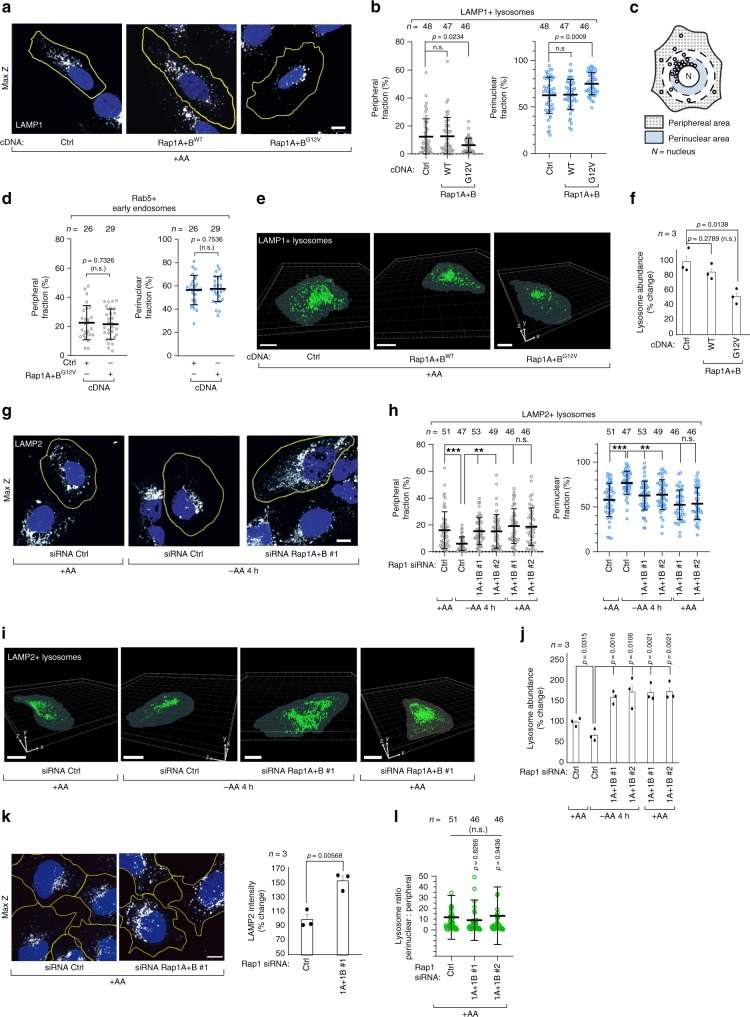
Fig. 3. Rap1 suppresses lysosome abundance and peripheral distribution upon limitation in amino acids.
a–j Effect of Rap1 activity on lysosome distribution and abundance. In a, g representative z-stack projections of endogenous lysosome distribution are shown for U2OS cells expressing wild-type (WT) or G12V Rap1A+B cDNA (a), or after 4 h of amino acid depletion (−AA 4 h) in combination with Rap1A+B depletion (g). The fraction of endosomes in the peripheral and perinuclear region was quantified in an automated fashion (b, c, d, h). Rab5 immunostainings are shown in Supplementary Fig. 3h. The percentage change in lysosomal abundance was quantified using 3D-reconstructions analysis of lysosomes (e, f, i, j). k, l Representative Z-stack projections showing increased lysosome staining in nutrient fed Rap1A+B-depleted HEK293A cells (k). Bar graph shows relative change in average LAMP2 intensity across three individual experiments for 57–72 cells. The ratio between perinuclear and peripheral lysosomes in nutrient fed Rap1A+B-depleted cells is quantified in l. The change in lysosome abundance is shown in Supplementary Fig. 4a, b. Cell boundaries are depicted in yellow and cell nuclei (DAPI) is shown in blue. Scalebars: a, g, k = 10 μm, e, i = 20 μm. The microscopic fields imaged were randomly selected. Experiments were repeated at least three times. In b, d, h, l n denotes the number of individual cells analyzed across three independent experiments and data are presented as mean values ± s.d. In f, j, k n denotes the number of individual experiments and data are presented as mean values ± s.e.m. The number of cells analyzed to quantify lysosome abundance is shown in Supplementary Fig. 14. n.s. = not significant (P > 0.05); Student’s t-test; two-sided, unpaired (d, f, j, k), one-way ANOVA with Tukey’s post hoc test (b, h, l). In h p = 0.8148 and 0.8994 for siRNA Ctrl vs Rap1A+B #1 and #2 peripheral lysosomes, and 0.5731 and 0.585 for siRNA Ctrl vs Rap1A+B #1 and #2 for perinuclear lysosomes, respectively. In b p = 0.9927 and 0.9819 for Ctrl vs Rap1 WT, peripheral and perinuclear fractions, respectively. ***P < 0.001, **P < 0.01 one-way ANOVA with Tukey’s post hoc test (h). See Source Data File for statistics source data.

