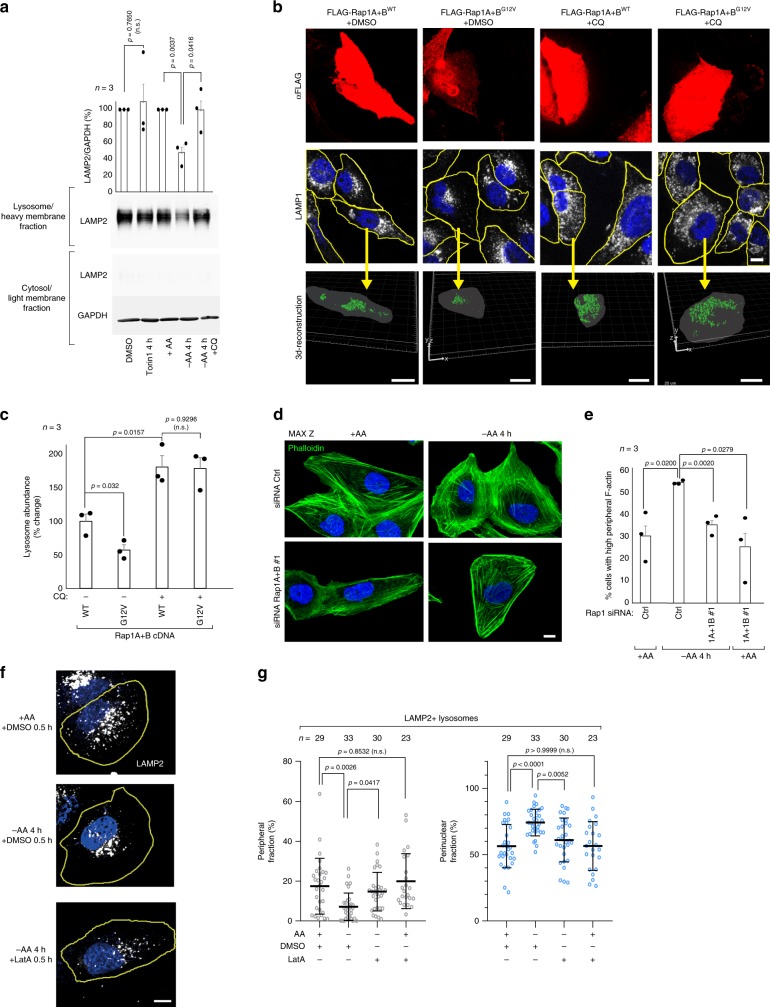
Fig. 4. Lysosome degradative function is required for Rap1 suppression of lysosome abundance.
a U2OS cells were subjected to 50 nM Torin1 or amino acid starvation in the presence or absence of 100 μM CQ for 4 h, and separated into lysosome-enriched heavy membranes and cytosolic fractions, and analyzed by immunoblotting for the indicated proteins. Cells were pretreated with CQ for 1 h before treatment was initiated. Graph shows the quantification of lysosome fraction from three individual experiments. b, c Representative Z-stack projections and 3d-reconstructions of the change in lysosomal abundance in U2OS cells transfected with the indicated FLAG-Rap1 cDNAs after treatment with 20 μM CQ for 24 h. 3d-reconstruction was performed on all FLAG-Rap1 cDNA expressing cells in the field of view. The yellow arrow indicates one representative cell for which the 3d-reconstruction is shown below. The percentage change in lysosomal abundance is quantified in c. The number of cells analyzed to quantify lysosome abundance is shown in Supplementary Fig. 14. Scale bars: middle panel 10 μm, lower panel 20 μm. d, e Amino acid starvation induces F-actin rearrangements in a Rap1-dependent manner, as shown in Rap1-depleted U2OS cells stained with Phalloidin (d), counting at least 300 cells per condition across three individual experiments and scoring for cells with increased peripheral F-actin (e). Scale bar: 10 μm. In f, g lysosomal distribution was assessed in U2OS cells that had been amino acid starved for 3.5 h and treated with either DMSO or 0.1 μM latrunculin A (Lat A) for an additional 30 min (total 4 h of starvation). Quantifications are shown in g. Also see Supplementary movie 16. Scale bar: 10 μm. The microscopic fields imaged were randomly selected. In g n denotes the number of individual cells analyzed across three independent experiments and data are presented as mean values ± s.d. In a, c, e n denotes the number of individual experiments and data are presented as mean values ± s.e.m. n.s. = not significant (P > 0.05); Student’s t-test; two-sided, unpaired (a, c, e), one-way ANOVA with Tukey’s post hoc test (g). See Source Data File for statistics source data. Uncropped images of blots are shown in Supplementary Fig. 17.

