Fig. 1.
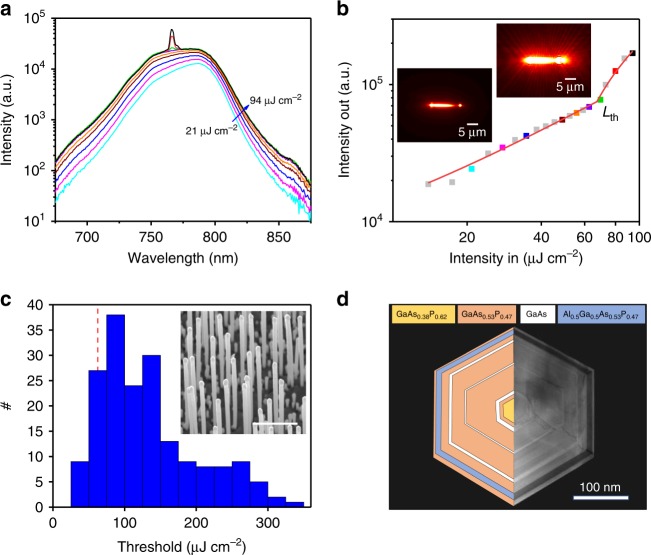
Characterisation of a typical NW laser. a Power-dependent emission spectra on a log scale, showing PL clamping at the onset of lasing, followed by narrow single-mode emission. b The light intensity-in vs. intensity-out plot corresponding to the same wire/data in a on a log–log scale (with the output measured within a narrow spectral range of λLas) and fit with the indicated threshold position (Lth). Data points are colour matched to the corresponding spectra in a, and the grey data points indicate additional powers not included in a. The two insets show emission images of the same NW, taken (left) just below and (right) above threshold, showing the emergence of spatially coherent emission from the end facets. c A histogram of the lasing thresholds for all 270 wires, with the example NL in a, b indicated by a vertical red dashed line. The inset shows an SEM image of the NWs after MBE growth, with the scale bar representing 5 μm in length. d TEM image of the NW cross-section (right) and schematic illustrating the structure (left)

