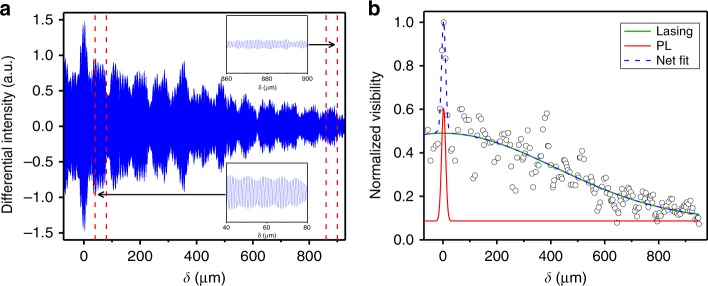
Fig. 2.
a A time-gated interferogram integrated over time 0 <τ < 1 ns after excitation. The two regions are expanded for clarity, showing coherence over hundreds of microns. The slow beating is indicative of two (unresolved) neighbouring lasing peaks, possibly arising from the broken degeneracy of the orthogonal transverse modes13,14. b The fitted visibility is shown for the data in a, indicating the spontaneous (red line) and lasing (green line) contributions to the fit (dashed blue line)

