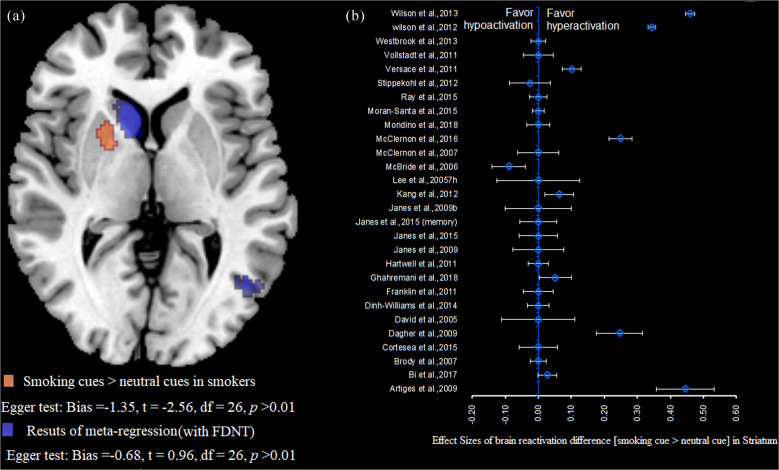
Fig. 3. Results of meta-regression in brain reactivity to smoking-related cues in smokers.
a The cluster within the striatum that showed greater activation in response to smoking-related cues compared with neutral cues and the cluster within the striatum that showed differences in the meta-regression analysis with FTND score as a factor. b Forest plot of the mean ± variance of effect sizes for activation differences in the striatum, estimated from individual studies with smoking-related cue exposure.

