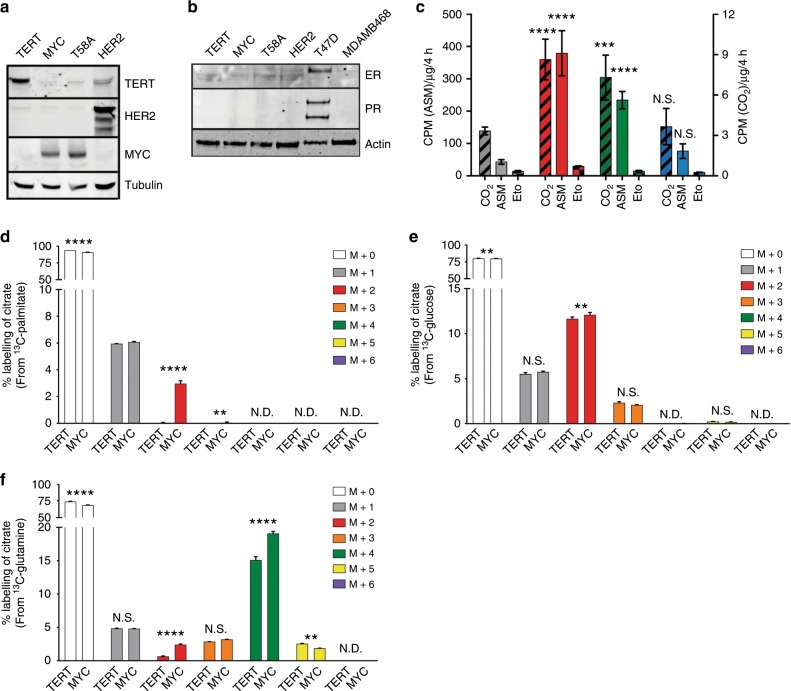
Fig. 1. MYC expression is sufficient to induce fatty acid oxidation in human mammary epithelial cells.
a Immunoblot analysis of TERT, HER2, and MYC protein expression in HME cell lines (stable pools). b Immunoblot analysis of oestrogen receptor (ER) and progesterone receptor (PR) in HME cells and human breast cancer cell lines. T47D breast cancer cells are positive for both ER and PR and served as a control for hormone receptor-positive cells. MDA-MB-468 lack expression of ER, PR, and HER2 and served as a control for triple negative breast cancer cells. c FAO of U-14C-palmitate in HME cells. Left y-axis represents carbon-14 labelling of acid soluble metabolites (ASM; solid bars). Right y-axis represents the capture of 14CO2 (black slashed bars) from HME cells, a readout of FAO. Etomoxir treatment is represented by the right y-axis and shows the inhibition of 14CO2 production from U-14C-palmitate (checkered bars). Throughout the manuscript, TERT = grey, MYC = red, T58A = green, HER2 = blue; n ≥ 3 independent experiments. Error bars represent mean ± standard deviation (s.d.). p Values were calculated using an unpaired Student’s t-test and are relative to TERT HME cells for each respective measurement. d–f LC-MS-based quantification of citrate labelling from cells treated with 0.05 mM U-13C-palmitate (d), 5.5 mM U-13C-glucose (e), and 0.65 mM U-13C-glutamine (f) for 30 min. The carbon-13 labelling is presented as a percent abundance of each isotopolog relative to the total citrate pool; n = 3 independent samples. Samples were measured in a single run on the mass spectrometer. Adjusted p values were calculated using an ordinary two-way ANOVA and Sidak’s multiple comparison test for each isotopolog; *p < 0.05, **p < 0.01, ***p < 0.001, ****p < 0.0001, N.S. = not significant, N.D. = not detected.

