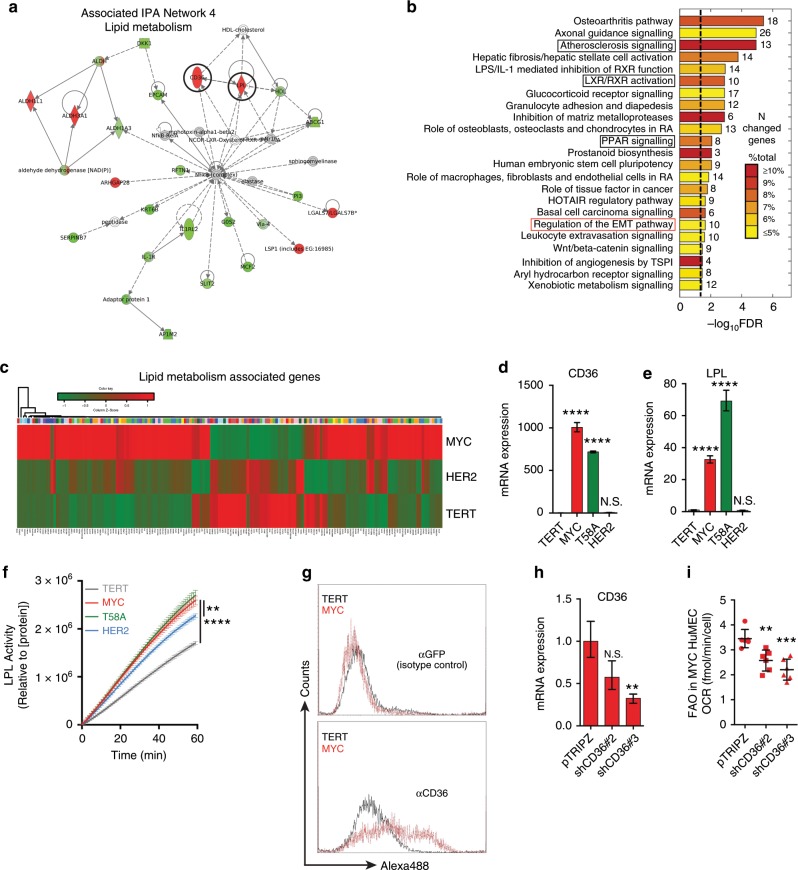
Fig. 2. MYC HME cells use LPL and CD36 to mobilise and take up fatty acids.
a Interaction map of the lipid metabolism gene network in MYC HME cells. Ingenuity Pathway Analysis was used to create the interaction map. Black circles highlight lipid metabolism genes CD36 and LPL. b Top canonical signalling pathways in MYC versus TERT HME cells based on RNA sequencing data (377 genes; FDR < 5%; minimum fold change: 6.81). Ingenuity Pathway Analysis was used to identify the pathways. Black boxes highlight gene ontologies associated with lipid metabolism. The value next to each bar represents the number of altered genes within the indicated signalling pathway. The colour of the bar indicates the percent of genes within the pathway that are differentially regulated. The black dotted line marks significance (FDR < 5%). c Heat map showing the relative expression of 163 genes associated with lipid metabolism in TERT, MYC, and HER2 HME cells (1.4 over all upregulated genes in MYC HME cells; p = 5 × 10⁻⁸ by Fisher Exact Test). Notable functions for those genes were related to lipid transport, acyl-CoA metabolism, mitochondrial b-oxidation, and lipases. d, e qRT-PCR analysis of mRNA expression of CD36 and LPL in HME cell lines; n = 3 independent experiments. All values are relative to β-actin and normalised to TERT HME cells. Bars represent mean with upper and lower limits; p values were calculated using an unpaired Student’s t-test. f Measurement of LPL activity in HME cell lysates; n = 4 independent experiments. Error bars represents mean ± s.d; p values were calculated using an unpaired Student’s t-test. g Flow cytometric analysis of CD36 surface expression in TERT (grey) and MYC (red) HME cells. Representative histograms from n = 2 independent experiments. αGFP (IgG) was used an isotype control (top histogram). h Relative mRNA expression of CD36 in MYC HME cells + pTRIPZ, MYC HME cells + shCD36#2, and MYC HME cells + shCD36#3. Cells were treated with 0.5 μg/ml doxycycline for 48 h to induce shRNA expression; n = 3 independent experiments. Error bars represent mean with upper and lower limits; p values were calculated using an unpaired Student’s t-test. i Basal OCR of MYC HME cells + pTRIPZ, MYC HME cells + shCD36#2, and MYC HME cells + shCD36#3. Cells were treated with doxycycline to induce shRNA expression prior to measurement of the OCR in the presence of 0.10 mM palmitate; n = 5 independent experiments. Error bars represent mean ± standard error of the means (s.e.m.); p values were calculated using an ordinary one-way ANOVA with Tukey’s multiple comparisons test; *p < 0.05, **p < 0.01, ***p < 0.001, ****p < 0.0001, N.S. = not significant.

