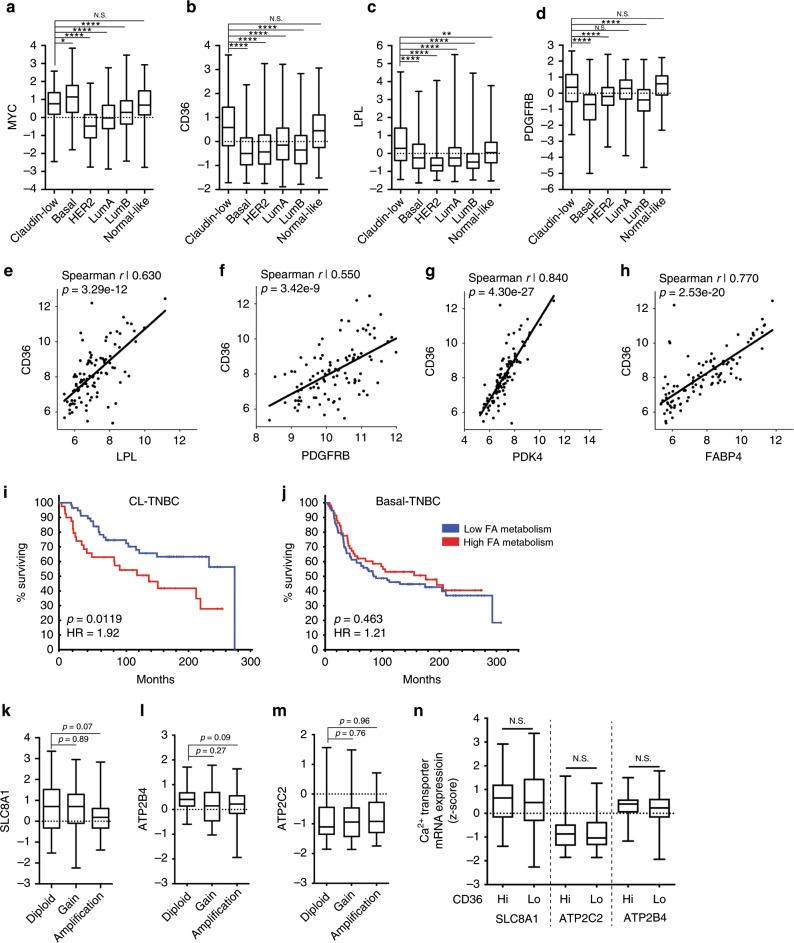
Fig. 5. The fatty acid metabolism gene expression signature of MYC HME cells is highly representative of human claudin-low breast tumours.
a–d Box and whisker plots of fatty acid metabolism gene mRNA expression levels (z-scores) in human breast cancer patient tumours from the METBRIC database. Tumours were classified based on the PAM50 + claudin-low molecular subtyping of breast cancer as called by the METABRIC database. Claudin-low, n = 182; Basal, n = 198; HER2, n = 218; Luminal A, n = 673; Luminal B, n = 454; Normal-like, n = 135. Boxes represent 25th to 75th percentile, whiskers represent min to max, and lines represent medians; p values were determined using an ordinary one-way ANOVA and Dunnett’s multiple comparison test. e–h Scatter plots of mRNA expression of CD36 against LPL, PDGFRB, PDK4, and FABP4 in CL-TNBC. Black lines represent linear regression of scatter plots. Spearman correlation r values and p values are reported on graphs. i, j Kaplan–Meier survival plots of patients with basal-TNBC (j) and CL-TNBC (i). Patients were stratified based on the expression of CD36, LPL, PDK4, and FABP4 as described in the results; p values were calculated using log-rank test. Hazard ratios (HR) are shown on the plots. k–m Box and whisker plots of Ca2+ transporter mRNA expression levels (z-scores) in CL-TNBC patient tumours. Tumours were divided in those with diploid, copy number gains, and amplification of MYC as called by the METBRIC database. Boxes represent 25th to 75th percentile, whiskers represent min to max, and lines represent medians; p values are reported on the graphs and were determined using an ordinary one-way ANOVA and Dunnett’s multiple comparison test. n Box and whisker plots of Ca2+ transporter mRNA expression levels (z-scores) in CD36Hi versus CD36Lo CL-TNBC patient tumours. Boxes represent 25th to 75th percentile, whiskers represent min to max, and lines represent medians; p values were determined using an unpaired Student’s t-test; *p < 0.05, **p < 0.01, ***p < 0.001, ****p < 0.0001, N.S. = not significant.

