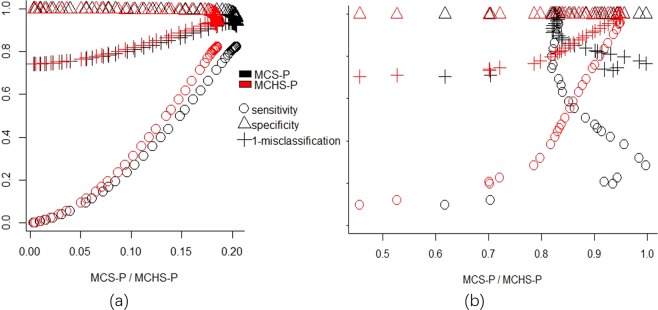
Figure 5.
Relationship of the MCHS-P and the MCS-P with classical performance measures. Subfigure (a) is for a homogeneous scenario such as 6000-urban-16, and shows that both the MCHS-P and the MCS-P have a positive relationship with the classic performance measure. Subfigure (b) is for a heterogeneous scenario such as 6000-three-16RR3.0-2.0-1.2, and it shows that the MCHS-P has a positive relationship with the classic performance measures, whereas the MCS-P has a nearly negative relationship with these performance measures.

