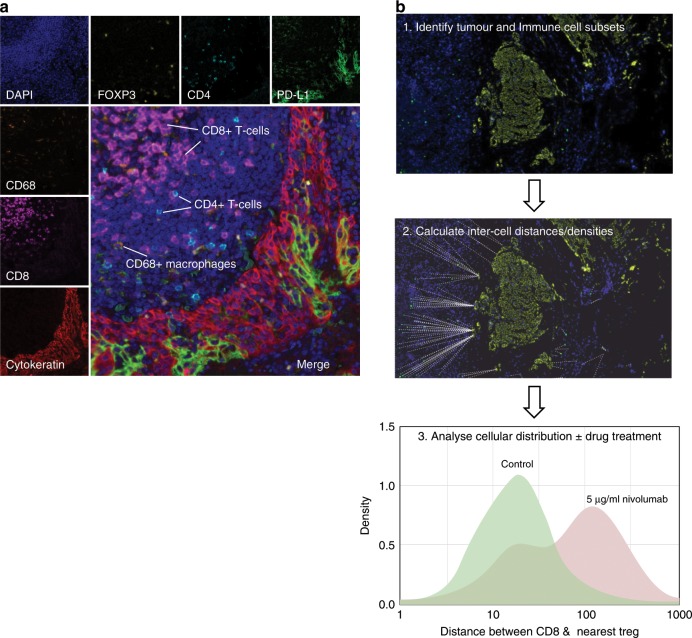
Fig. 4. Multiplexed immunofluorescence.
a A section of a PDE stained with DAPI as well as antibodies specific for immune cell markers (CD4, CD8, CD68 and FOXP3), PD-L1 and pan-cytokeratin followed by TSA-based fluorescent labelling is shown. This method allows for the characterisation of immune-cell subsets in the tumour microenvironment. b Measurement of inter-cell distances in PDEs pre- and post drug treatment. In this example, a melanoma PDE is analysed pre- and post-treatment with the anti-PD1 immunotherapy Nivolumab. To analyse inter-cell distances, PDEs are first stained with relevant cell markers such as tumour or immune-cell subsets followed by digital scanning of images (1). Cells are then identified and phenotyped using Inform software, and distances calculated using the R programming environment (2). The example shown in the histogram (3), indicates increased distance between CD8+ effector T cells and CD4+FOXP3+ regulatory T cells (Tregs) following Nivolumab treatment, confirming on-target effects of this anti-PD1 immunotherapy within the PDE. These images are the authors’ unpublished original data.

