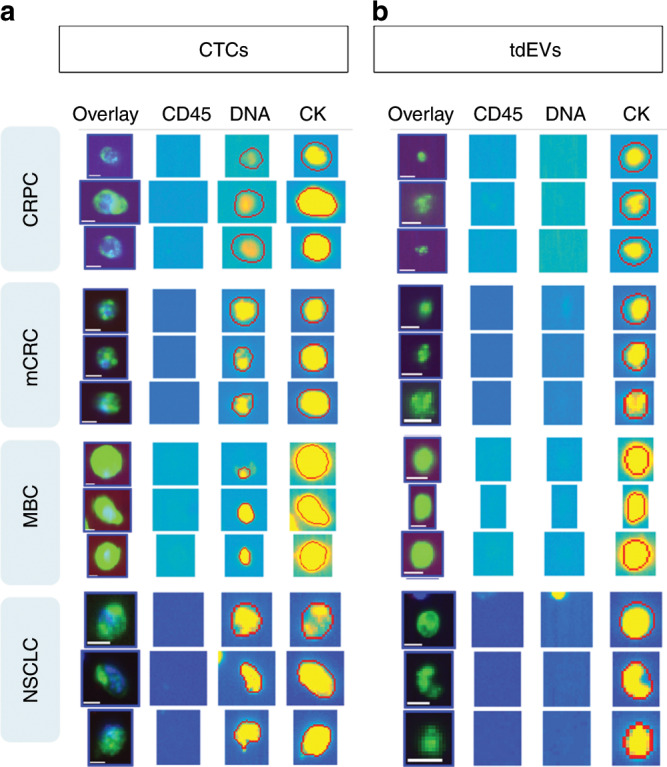
Fig. 1.

Examples of objects manually classified as CTCs by individual users (a) or automatically classified as tdEVs using the open-source ACCEPT software (b) on images obtained from CRPC, MBC, mCRC and NSCLC cancer patients. The red contours around the objects indicate the contours as detected by the ACCEPT image analysis algorithm. All objects were isolated from 7.5 mL of blood using the CellSearch system. Scale bars indicate 6.4 μm.
