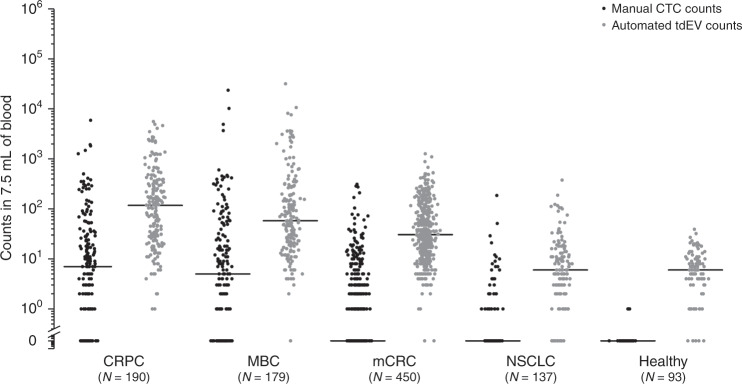
Fig. 2. Dot plots of manual CTC counts (in black) and automated tdEV counts (in grey) in the blood of individuals with different cancer types.
Horizontal black lines indicate median values. tdEV counts are significantly higher compared to the respective CTC counts in CRPC, MBC, mCRC and NSCLC cancer patients (p < 0.05 for all 4 comparisons, Wilcoxon Signed Ranks test). CTC and tdEV counts of 93 healthy donors were used as a reference.

