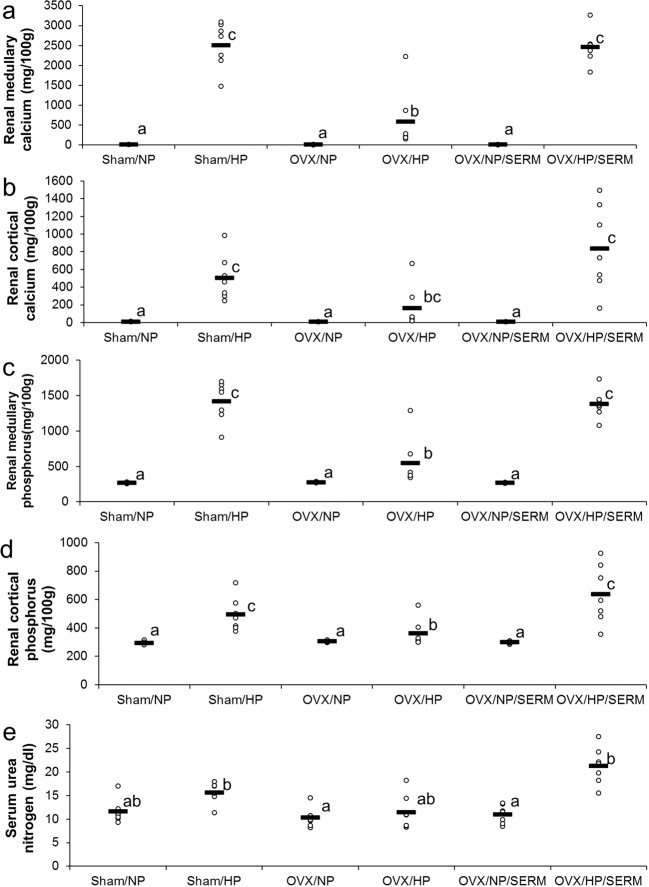
Figure 3.
Effects of SERM administration on renal calcification in OVX rats fed with HP diet (Experiment 2): Scatter plots represent individual rats (n = 7), and horizontal bars through the plots indicate the mean values. Bars with different letters are significantly different (p < 0.05). (a) Renal medullary calcium concentration. (b) Renal cortical calcium concentration. (c) Renal medullary phosphorus concentration. (d) Renal cortical phosphorus concentration. (e) Serum urea nitrogen levels. NP, normal phosphorus diet; HP, high phosphorus diet; OVX, ovariectomy; SERM, selective estrogen-receptor modulator.

