Figure 5.
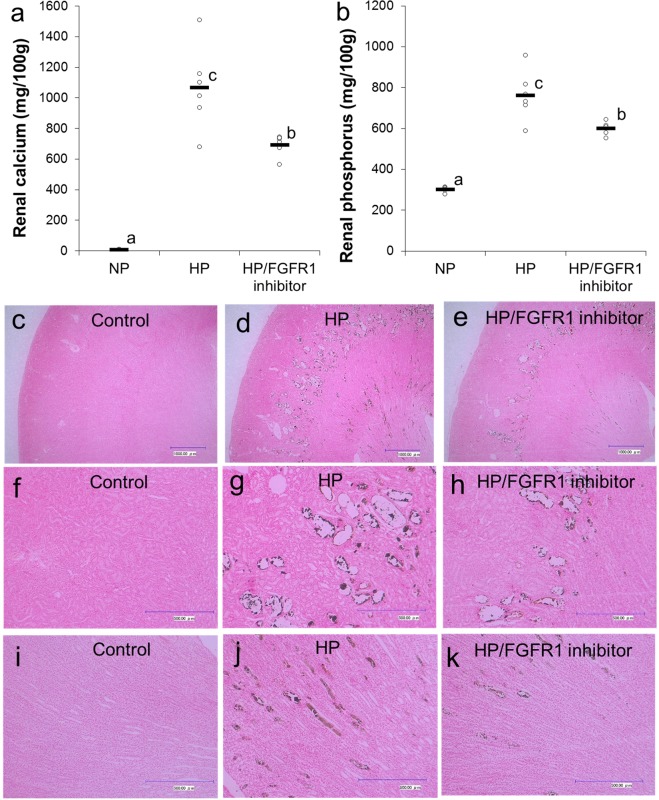
Effects of FGFR1 inhibitor on nephrocalcinosis induced by HP diet (Experiment 3): Scatter plots represent individual rats (n = 6), and horizontal bars through the plots indicate the mean values (a,b). Bars with different letters are significantly different (p < 0.05). (a) Renal calcium concentration. (b) Renal phosphorus concentration. Representative images of Von Kossa staining of longitudinal section of the kidney tissues in the NP group (c, f, i), HP group (d,g,j) and HP/FGFR1 inhibitor group (e,h,k). Original magnification, ×50 (c–e) or ×200 (f–k). Bar = 1000 µm (c–e) or 500 µm (f–k). NP, normal phosphorus diet; HP, high phosphorus diet; FGFR1, fibroblast growth factor receptor 1.

