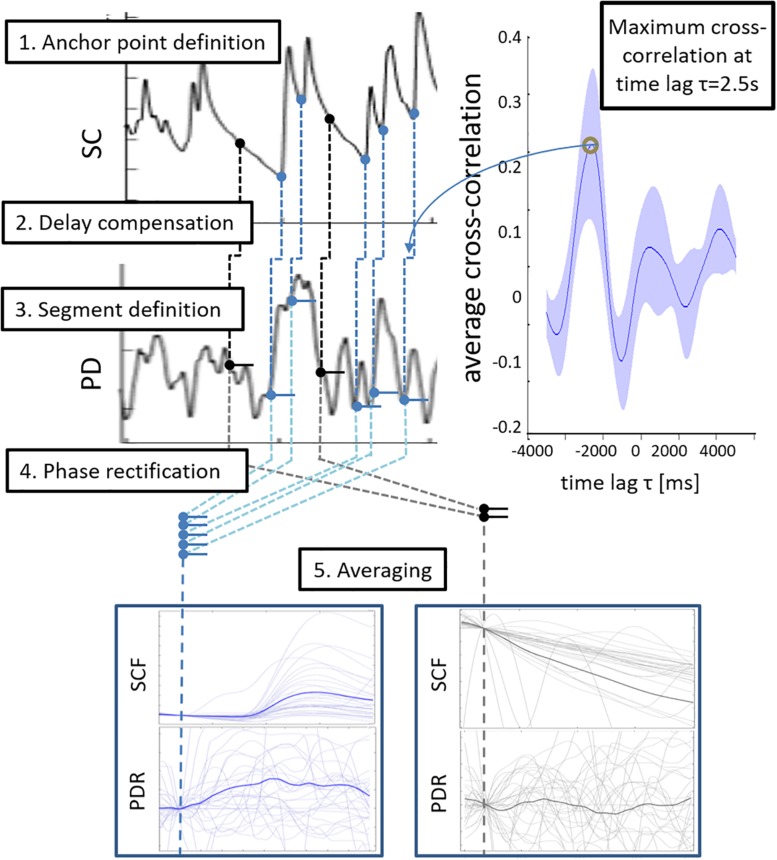
FIGURE 1.
Schematic illustration of the bivariate phase rectified signal averaging (PRSA) procedure. Step 1: Onsets of skin conductance fluctuations (SCF) served as anchor points (blue circles). Randomly defined anchor points were used as reference condition (black circles). Step 2: Anchor points were transferred to the pupil diameter signal (PD) with a temporal delay of 2.5 s as the mean cross correlation function of skin conductance and PD changes reached its maximum at this time lag. Step 3: Delay-compensated anchor points were used to extract segments of pupil diameter responses (PDR). Step 4: Segments were phase-rectified and normalized. Step 5: PDR segments were averaged and analyzed.

