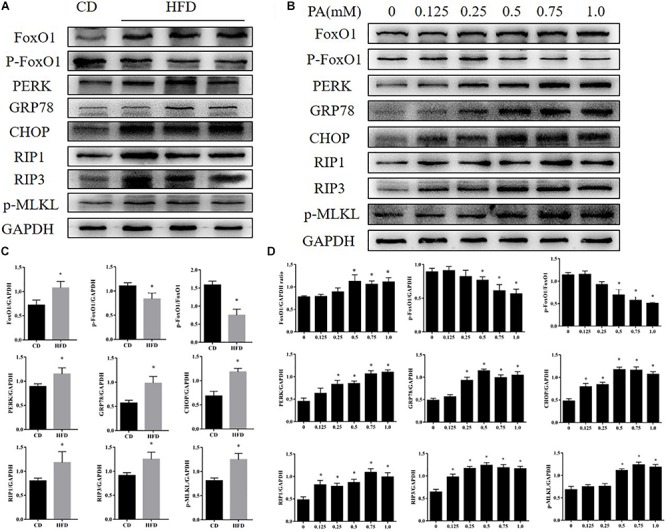
FIGURE 2.

Effects of PA on FOXO1, ER stress, and necroptosis in AML12 cells. (A) Immunoblot analysis of FoxO1, p-FoxO1, PERK, GRP78, CHOP, RIP1, RIP3, p-MLKL in CD and HFD feeding mice. (B) Immunoblot analysis of FoxO1, p-FoxO1, PERK, GRP78, CHOP, RIP1, RIP3, p-MLKL in cells treated with PA. (C) Quantitative analysis of (A). (D) Quantitative analysis of (B) ∗P < 0.05 vs. CD controls. t-Test, data are shown as mean ± standard deviation.
