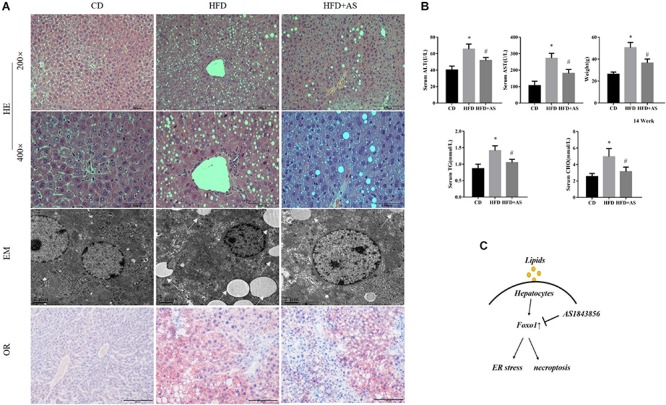
FIGURE 4.

Effects of inhibition of FOXO1 in mice fed with a high fat diet. (A) Representative H&E staining, Oil red staining and Transmission electron microscopy of liver sections after CD or HFD or HFD + AS. (B) Weight, TG, AST, ALT, and CHO in CD, HFD, HFD + AS. (C) Graphical abstract. #P < 0.05 vs. HFD controls, ∗P < 0.05 vs. CD controls. t-Test, data are shown as mean ± standard deviation.
