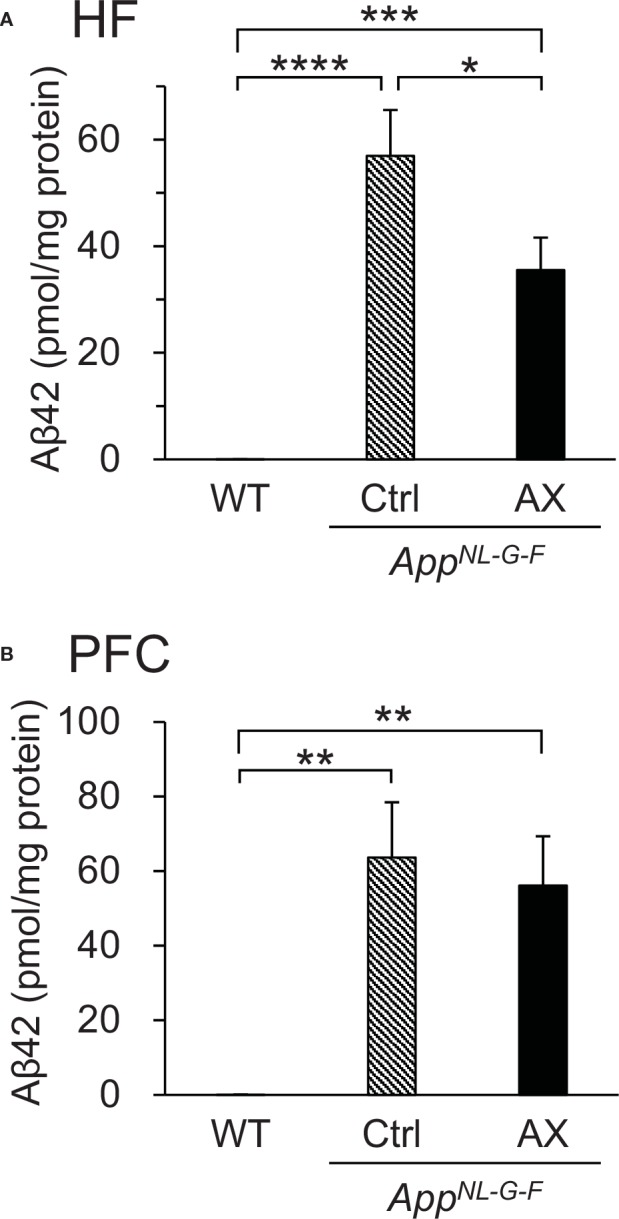
Figure 4.

Comparison of Aβ42 levels quantified by ELISA among the three groups of mice. (A) Comparison of Aβ42 levels in the hippocampus (HF). (B) Comparison of Aβ42 levels in the prefrontal cortex (PFC). WT, wild type C57BL/6J mice; AppNL-G-F, AppNL-G-F/NL-G-F mice; Ctrl, control-fed group; AX, astaxanthin-fed group. *P < 0.05; **P < 0.01; ***P < 0.001; ****P < 0.0001.
