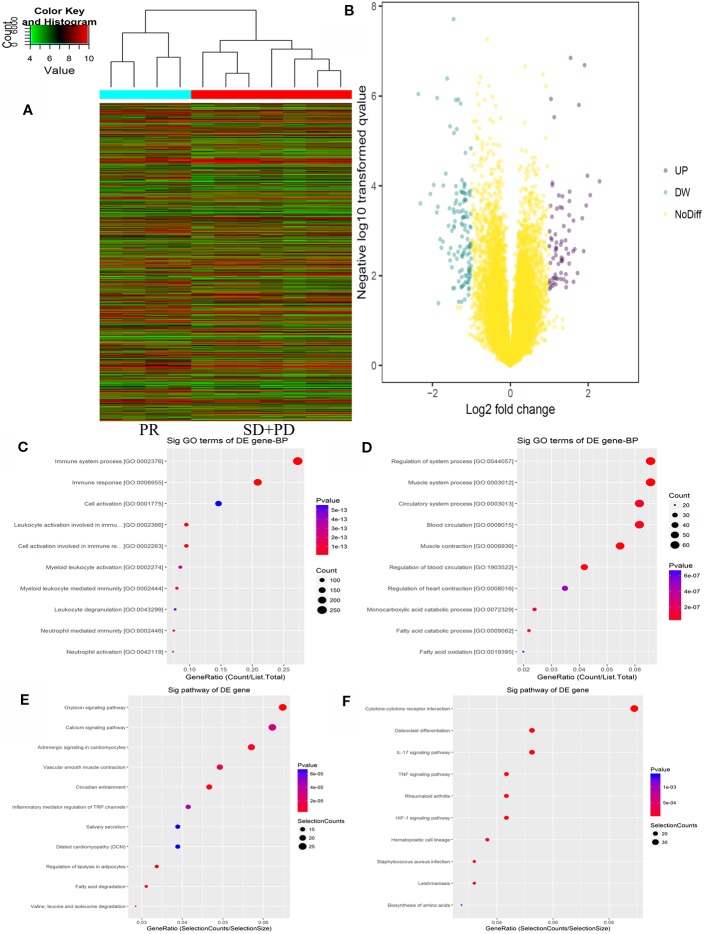
Figure 2.
mRNAs expression profile comparison between chemotherapy-resistance and chemotherapy-sensitivity groups. Gene Ontology (GO) functional and Kyoto Encyclopedia of Genes and Genomes (KEGG) pathway analysis of the differentially expressed genes. (A) The hierarchical clustering of all targets value of mRNA expression profiling among samples. (B) between the chemotherapy-resistance and chemotherapy-sensitivity group. The purple dots indicated the up-regulated genes of mRNAs and the green dots indicated the down-regulated genes of mRNAs. (C) GO functional analysis of the top ten functional classifications of the upregulated genes. (D) GO functional analysis of the top ten functional classifications of the downregulated genes. (E) KEGG pathway analysis of the top ten significant pathways of upregulated genes. (F) KEGG pathway analysis of the top 10 pathways of downregulated genes.

