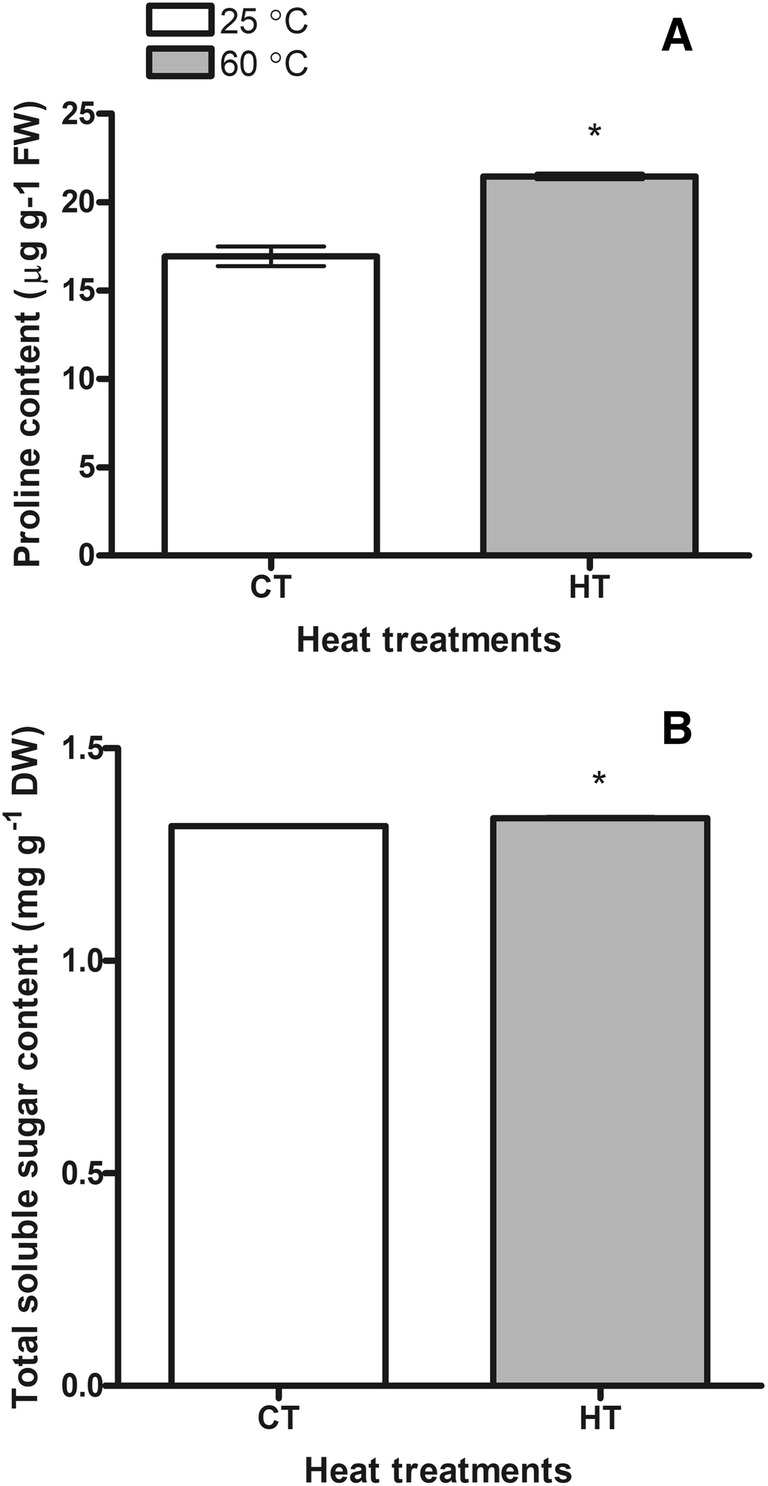
Fig. 4.

Changes of proline (a) and total soluble sugar (b) contents of the control (CT 25 ± 3 °C) and the high temperature (HT 60 ± 4 °C) plants. Bars on the columns are standard deviations. Statistically significant differences are indicated by asterisks
