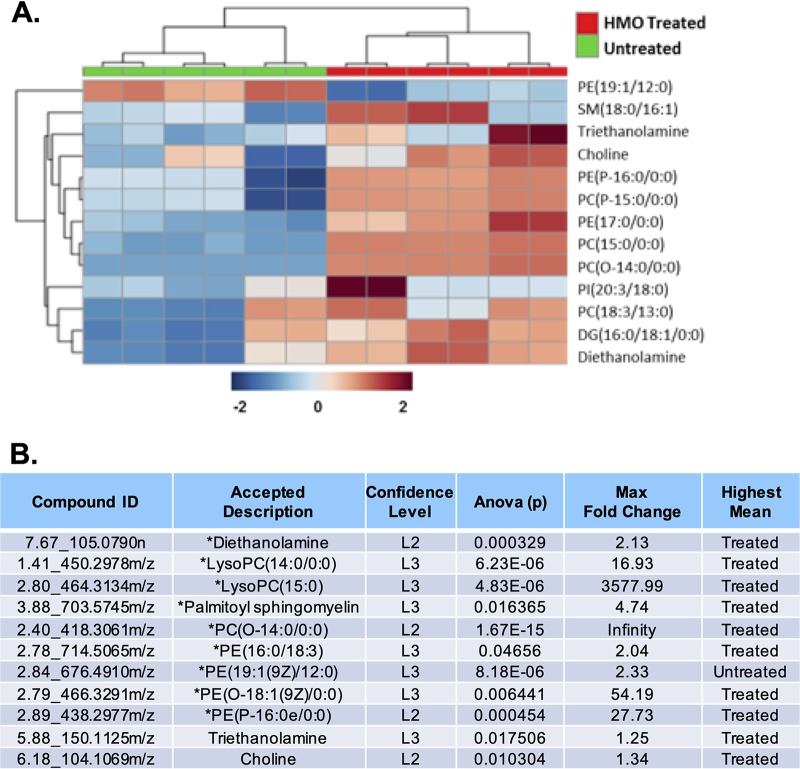
FIG 3.
Glycerophospholipid-associated metabolite identification and statistical representation. (A) Heat map visualization of the significantly differently regulated glycerophospholipid metabolism pathway upon HMO treatment. Glycerophospholipid members shown here were detected by HILIC-positive LC-MS/MS analysis. Samples (columns) and metabolite compounds (rows) were processed using Euclidean average clustering via MetaboAnalyst 4.0. The heat map was generated for Pareto-scaled, log-transformed data, and colors are displayed by relative abundance, ranging from low (blue) to high (red), as shown in the legend. SM, sphingomyelin; PC, phosphocholine; PI, phosphoinositol; DG, diglyceride; LysoPC, lysophosphatidylcholine. (B) Corresponding data table of glycerophospholipid metabolites, where the asterisk (*) denotes significance with a P value of ≤0.05 and fold change of ≥|2|.

