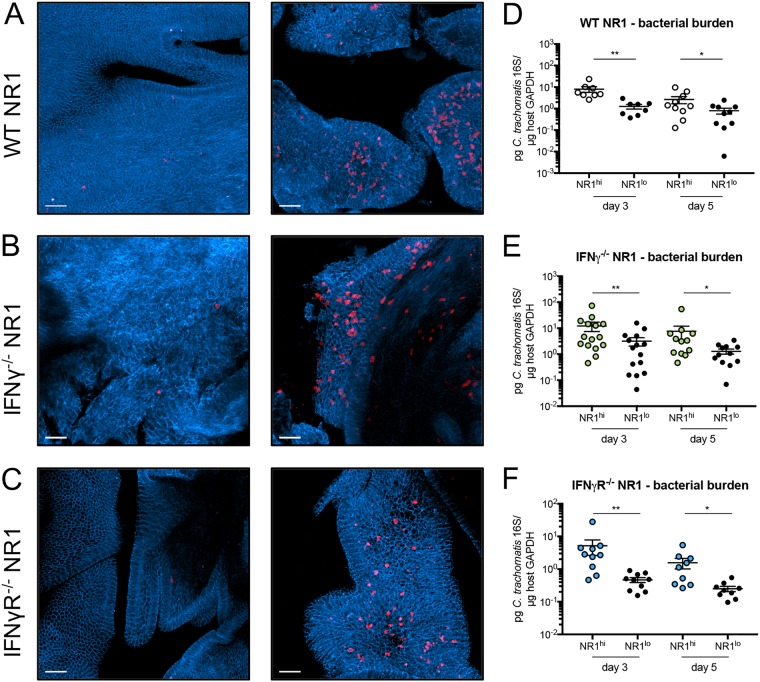
FIG 2.
NR1 T cells localize to sections of the genital tract containing C. trachomatis. E-cadherin–CFP mice (A to C) or B6 mice (D to F) received 106 (A and D) WT RFP NR1 T cells, (B and E) IFN-γ−/− RFP NR1 T cells, or (C and F) IFN-γR−/− RFP NR1 T cells 1 day prior to transcervical infection with 5 × 10⁶ IFU C. trachomatis. (A to C) Five days postinfection, upper genital tracts were harvested and visualized by two-photon microscopy for NR1 T cell homing. Images are maximum projections obtained from a depth up to 100 μm, and scale bars denote 50 μm. (D to F) At 3 and 5 days postinfection, genital tracts were subdivided into sections visibly containing NR1 T cells (NR1hi) or not containing NR1 T cells (NR1lo). Tissue sections were analyzed by quantitative PCR (qPCR) for bacterial burden. Data shown in panels D to F were pooled from results of two independent experiments performed with at least five mice each and were analyzed using Wilcoxon matched-pairs signed rank test. *, P < 0.05; **, P < 0.01.

