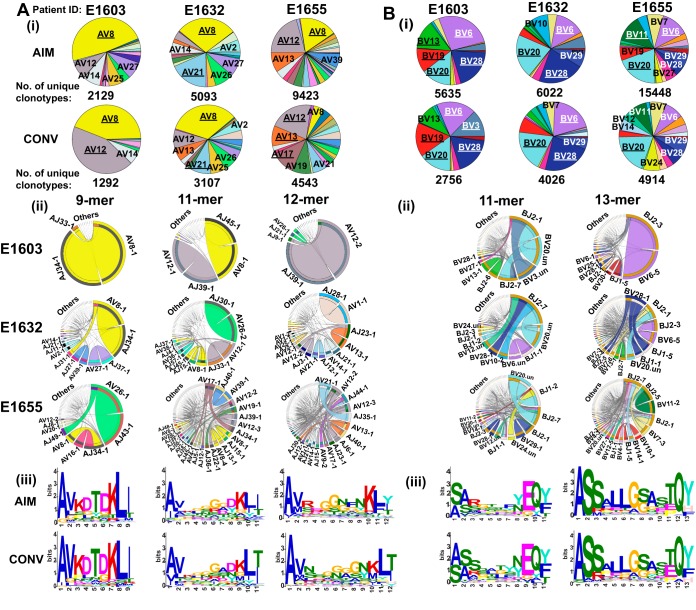
FIG 6.
Nonamer TCRα AV8.1-VKDTDK-AJ34 drives the selection of YVL-BR-specific CD8 T cells in AIM and CONV. HLA-A2/YVL-BR-specific TCRα (A) and TCRβ (B) repertoires were analyzed for 3 AIM donors (E1603, E1632, and E1655) during the acute (within 2 weeks of onset of symptoms; primary response) and convalescent (6 months later; memory response) phases of EBV infection. The frequency of each TRAV (A) and TRBV (B) in total HLA-A2/YVL-BR-specific TCR repertoire is shown in pie charts (i). The pie plots are labeled with gene families having a frequency of ≥10% (dominant; underlined) or between 5% and 10% (subdominant; not underlined). The total number of unique clonotypes in each donor is shown below the pie charts. (ii) Circos plots depicting V-J gene pairing. (iii) CDR3 motif analysis for the clonotypes with the two most dominant CDR3 lengths. Circos plots are shown for only the memory phase (AIM Circos plots are shown in Fig. 7 and 8 and Fig. S1). The frequencies of V-J combinations are displayed in Circos plots, with the frequency of each V or J cassette represented by its arc length and that of the V-J cassette combination by the width of the arc. “.un” denotes V families where the exact gene names were unknown.

