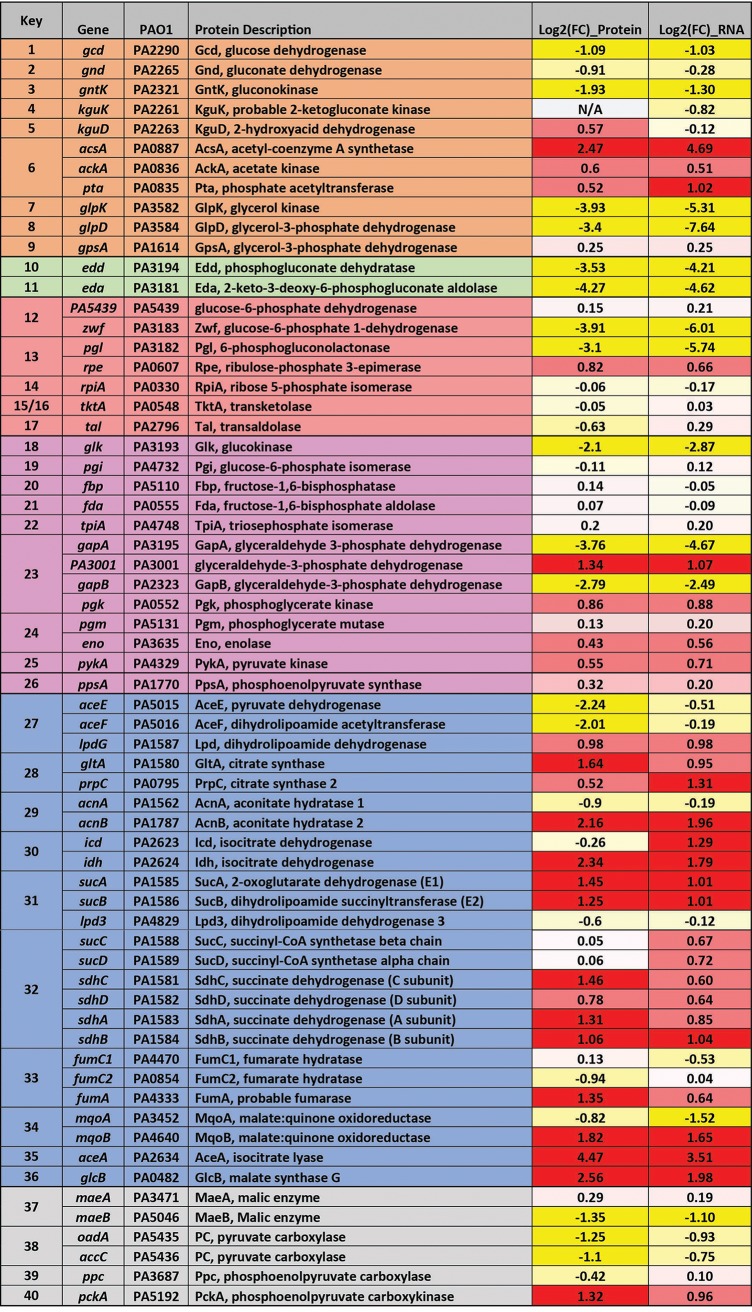
FIG 2.
Comparison between protein and transcript fold changes (FC) for selected P. aeruginosa enzymes involved in central carbon metabolism. The figure shows the log2 fold changes in protein and transcript levels in (i) the peripheral pathways that encompass the oxidative transformation of glucose, acetate, and glycerol and the corresponding phosphorylated derivatives of these metabolites (orange); (ii) EMP pathway (nonfunctional, due to the absence of 6-phosphofructo-1-kinase activity) (purple); (iii) the pentose phosphate (PP) pathway (red); (iv) the upper ED pathway (green); (v) the tricarboxylic acid cycle and glyoxylate shunt (blue); and (vi) anaplerotic and gluconeogenic bioreactions (gray). RNA-Seq and proteomic data are shown in Data Set S1. Correlation plots are shown in Data Set S3.

