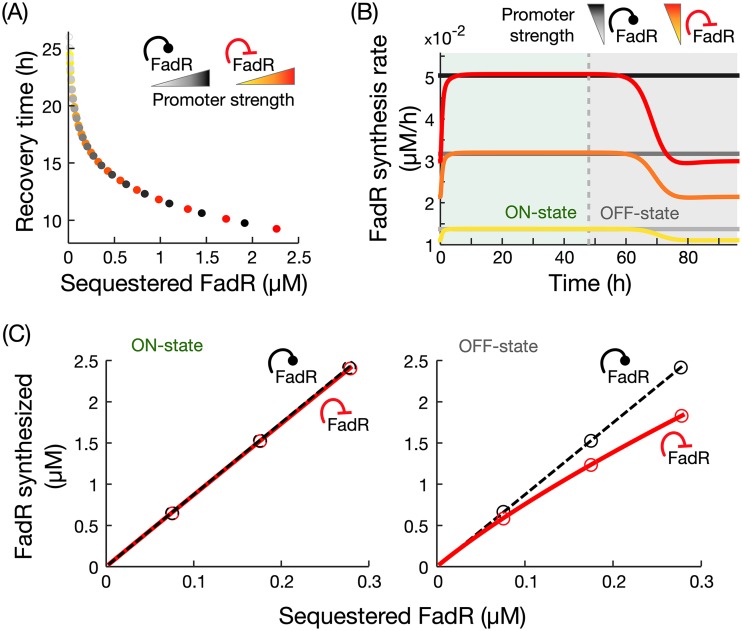
FIG 4.
Comparison of recovery dynamics in constitutive expression and negative autoregulation. (A) Simulated recovery times for variations in the strength of FadR’s own promoter, with the two architectures achieving the same recovery times. (B) Time course simulations of FadR synthesis rates for 48 h in the on state (1 mM oleic acid) and off state, for increasing promoter strengths; the yellow curve represents the response with the fitted promoter strength value (Table S2B). To ensure fair comparison, promoter strengths were chosen to achieve the same recovery times in the two architectures. (C) Cost of FadR synthesis for increasing concentrations of sequestered FadR, modified by changes to fadR promoter strength. Circles correspond to costs associated with simulations shown in panel B. Details of the simulations are in Materials and Methods.

