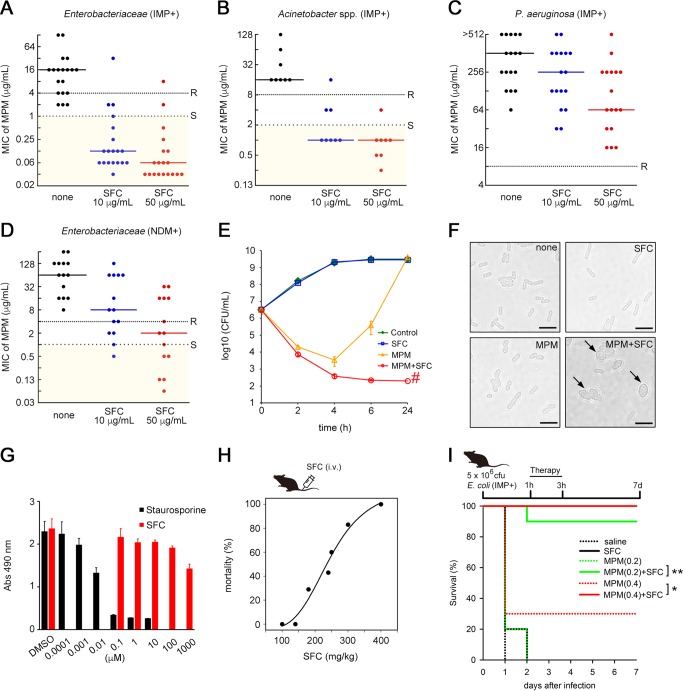
FIG 2.
SFC rescues the activity of MPM. (A to D) Plots showing the MPM MIC values for 19 IMP-type MBL-producing Enterobacteriaceae (A), 8 Acinetobacter spp. (B), 17 P. aeruginosa strains (C), and 14 NDM-type MBL-producing Enterobacteriaceae (including 1 dually NDM/VIM-producing K. pneumoniae strain) (D). MIC values greater than or equal to those represented by the dense dotted lines indicate the “resistant” (R) criteria according to CLSI guidelines, while those less than or equal to those represented by the spaced dotted lines indicate the “susceptible” (S) criteria. Solid lines represent the MIC50 values. (E) Time-kill curves of IMP-1-producing E. coli NUBL-24 strain in the presence of MPM or SFC alone or their combination during a 24-h incubation. Data represent the means ± SD of results from three independent experiments. The symbol “#” indicates the detection limit (200 CFU/ml). (F) Representative cell morphology images of E. coli NUBL-24 after exposure to MPM and/or SFC. Scale bars = 5 μm. Arrows indicate round cells. (G) Cytotoxicity of SFC and staurosporine in HeLa cells. Abs, absorbance. (H) Dose-response mortality curve of intravenously injected SFC in mice (n = at least 5 mice per dose). (I) Mouse survival curves from evaluations of the therapeutic effect of MPM (0.2 or 0.4 mg/kg of body weight) or SFC (100 mg/kg) alone or in combination. Mice were intraperitoneally infected with IMP-1-producing E. coli NUBL-24 (5 × 10⁶ CFU; n = 10 mice per group). Statistical analyses of Kaplan-Meier survival curves were performed with a log rank test using the SigmaPlot 13 suite (Hulinks). *, P = 0.01; **, P < 0.001.

