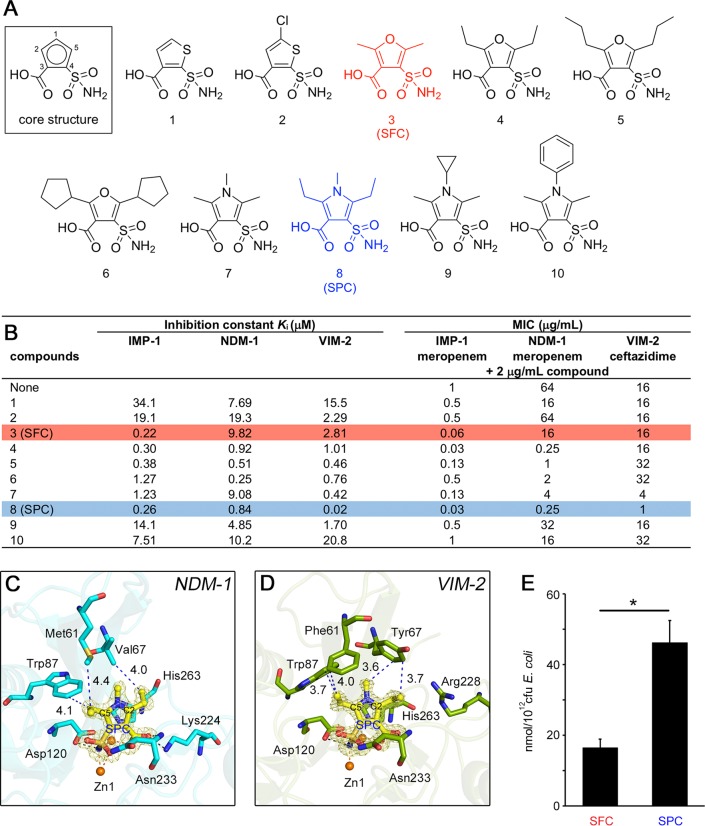
FIG 4.
In vitro evaluation of synthesized SHCs and mode of NDM-1/VIM-2 inhibition by SPC. (A and B) Chemical structures of 10 SHCs (A) and their evaluations (B). Ki values represent the means of results from three replicates. E. coli DH5α/pBC-IMP-1, E. coli DH5α/pBC-NDM-1, and E. coli DH5α/pBC-VIM-2 were used for the determination of MIC values. The colors of the highlighted rows correspond to the colors highlighting chemical structures in panel A. (C) Interactions between NDM-1 and SPC. The |Fo| − |Fc| omit map of SPC, which was contoured at 3.0σ (yellow mesh), is shown. SPC is illustrated using yellow (carbon), ochre (sulfur), red (oxygen), and blue (nitrogen) sticks. The amino acids of NDM-1 are represented by cyan sticks. Zinc ions are illustrated as orange spheres. Black and orange dashed lines indicate hydrogen and coordination bonds, respectively. The distances between SPC and the amino acids of L3 loop are illustrated as blue dashed lines together with numbers (Å). (D) Interactions between VIM-2 and SPC. The amino acids of VIM-2 are represented by deep-green-colored sticks. Other architecture is colored as described for panel C. (E) Accumulation assay of SFC and SPC incorporated in E. coli K-12 MG1655. Data represent the means ± SD of results from three independent experiments. Statistical significance was determined by Welch’s t test. *, P < 0.01.

