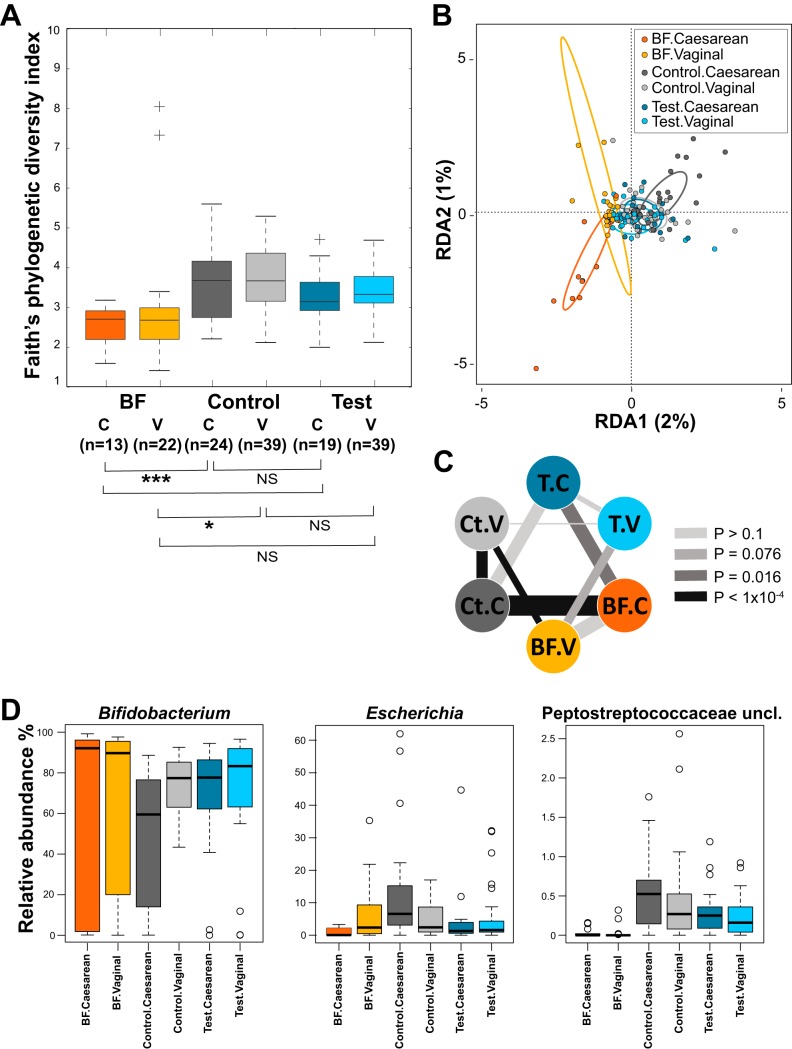
FIG 3.
Comparison of microbiota compositions between feeding groups stratified by delivery modes at 3 months of age. (A) Alpha diversity. Box plots of the phylogenetic distances measured by the Faith’s diversity index. (B) RDA at the genus level. Colored ellipses identify the 95% confidence interval around the centroid of each group. Two outliers of the BF.vaginal group are not shown on this figure. (C) Dissimilarities of microbiota. The thickness of the lines represents the dissimilarity between groups (line weight is proportional to average pairwise Bray-Curtis distances at the genus level). Separation between groups was assessed by the distribution of pairwise distances (when between groups’ distances > within groups’ distances; assessed by Wilcoxon rank test) and shown as color-coded P values (the darker the color, the more significant the separation). (D) Box plots of relative abundances for three genera. Median values are shown in boxes encompassing the interquartile range; whiskers show the 5% to 95% range; crosses (diversity) or circles (genera) show the outliers. Significance by t test: *, P < 0.05; ***, P < 0.005; NS, not significant; BF, breastfed reference group; Ct, control group; T, test group; C, Caesarean delivery; V, vaginal delivery. Sample size for each group is shown in panel A; n, number of samples.

