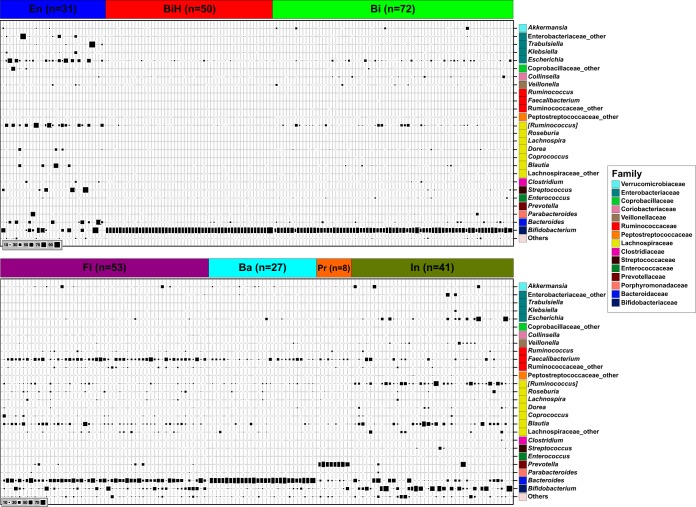
FIG 4.
Bubble plot of the 26 most dominant bacterial genera in stool samples (at 3 and 12 months of age) clustered in seven FCTs. Each column describes one sample. The size of the squares depicts the relative abundance (bottom left code). Taxa are shown for each row at the right with family level color-coded boxes. n, number of samples.

