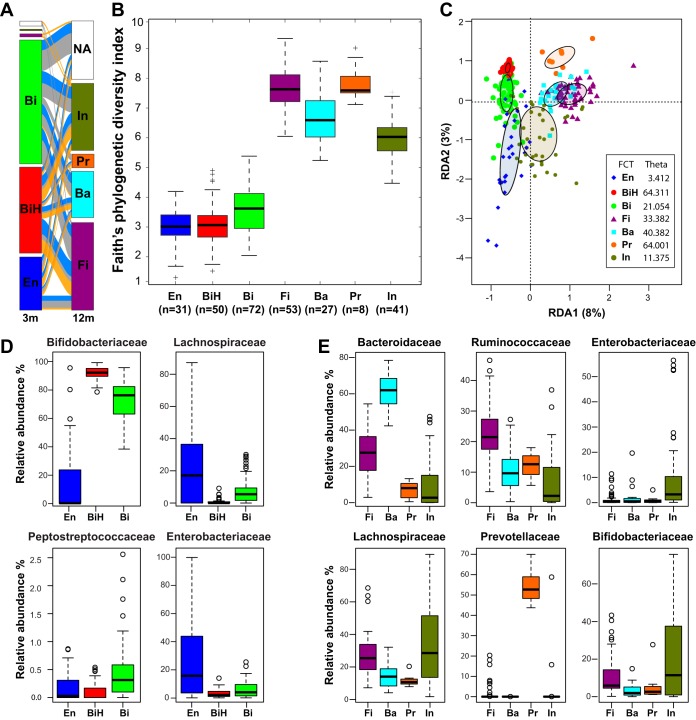
FIG 5.
Description of the fecal community types. (A) Distribution of the FCTs at 3 and 12 months (3m and 12m, respectively). Transitions between the FCTs are depicted by the streams colored by feeding group (orange, BF; gray, control; blue, test). NA, sample not available. (B) Alpha diversity of the FCTs. Box plots of the phylogenetic distances measured by the Faith’s diversity index. Median values are shown as boxes encompassing the interquartile range; whiskers show the 5% to 95% range; crosses show the outliers. All FCTs showed a different distribution (t test; P value < 0.05) except for two comparisons: FCT En versus FCT BiH and FCT Fi versus FCT Pr. (C) RDA at the genus level. Filled ellipses indicate the 95% confidence interval (CI) around the centroids of each data set. (D) Box plots of relative abundances at the family level for dominant FCTs at 3 months. (E) Box plots of relative abundances at the family level for dominant FCTs at 12 months. Median values are shown as boxes encompassing the interquartile range; whiskers show the 5% to 95% range; circles show the outliers. Sample size for each group is shown in panel B; n, number of samples.

